March 17, 2026 a 03:31 pm

VST: Dividend Analysis - Vistra Corp.
Vistra Corp., with a significant market capitalization, presents a notable dividend profile characterized by a moderate dividend yield. The company's commitment to maintaining regular dividend payments over the years is a positive indication for stable income-oriented investors.
📊 Overview
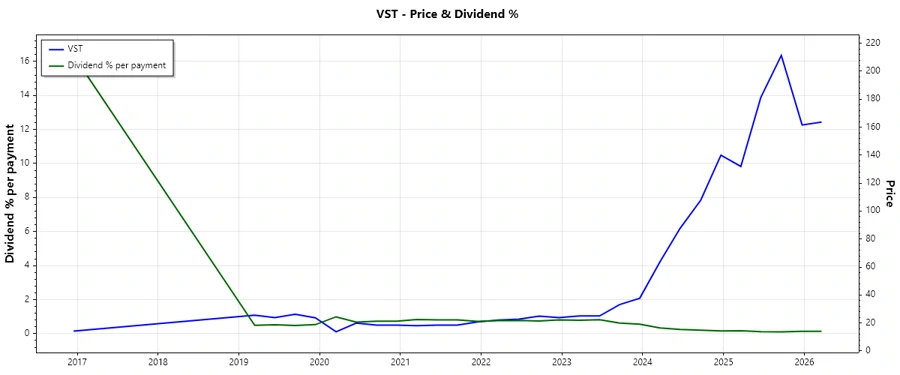
Vistra Corp. operates in a sector known for steady cash flow, crucial for sustaining dividend distributions. Its dividend yield, currently at 0.55%, reflects a modest return for income-focused portfolios. The company has demonstrated its ability to sustain dividends for 9 years without cuts, which highlights resilience.
| Metric | Detail |
|---|---|
| Sector | Utilities |
| Dividend yield | 0.55% |
| Current dividend per share | 1.47 USD |
| Dividend history | 9 years |
| Last cut or suspension | None |
📉 Dividend History
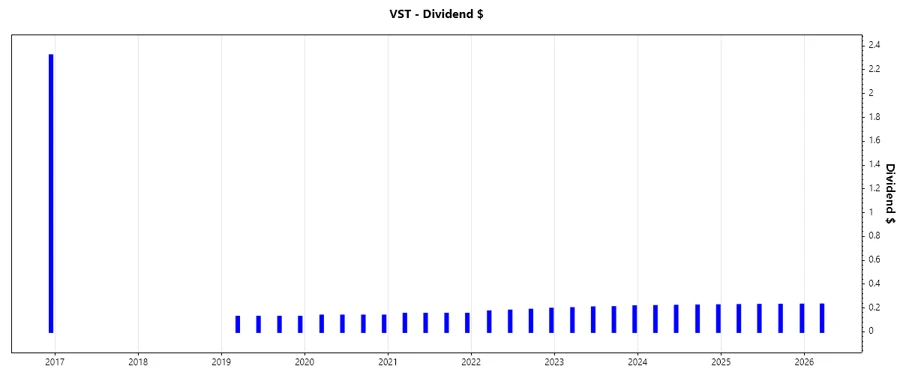
The historical dividend payments underscore Vistra Corp.'s commitment to its shareholders. Maintaining a stable dividend history is crucial for investor confidence and reflects positively on management’s financial stewardship.
| Year | Dividend per Share (USD) |
|---|---|
| 2026 | 0.228 |
| 2025 | 0.9015 |
| 2024 | 0.8735 |
| 2023 | 0.8205 |
| 2022 | 0.724 |
📈 Dividend Growth
Dividend growth is a vital indicator of a company’s financial health and future growth potential. Vistra Corp.'s dividend growth rate over the last 3 years is 7.58%, with a 5-year growth of 10.79%, indicating a steady increase in shareholder returns.
| Time | Growth |
|---|---|
| 3 years | 7.58% |
| 5 years | 10.79% |
The average dividend growth is 10.79% over 5 years. This shows moderate but steady dividend growth.
✅ Payout Ratio
The payout ratio is an essential metric for assessing dividend sustainability. An EPS-based payout ratio of 52.75% suggests that Vistra Corp. has a conservative payout, allowing room for reinvestments and growth. The FCF payout ratio of 77.59% is somewhat higher, reflecting a firm commitment to shareholder returns while maintaining operational investments.
| Key Figure Ratio | Percentage |
|---|---|
| EPS-based | 52.75% |
| Free cash flow-based | 77.59% |
💵 Cashflow & Capital Efficiency
Vistra Corp.'s ability to generate cash flow and manage capital efficiently is critical for sustaining its dividend payments. Key metrics such as free cash flow yield and CAPEX to operating cash flow ratios provide insight into financial flexibility and reinvestment abilities.
| Year | 2023 | 2024 | 2025 |
|---|---|---|---|
| Free Cash Flow Yield | 26.52% | 5.23% | 0.24% |
| Earnings Yield | 10.48% | 5.59% | 1.72% |
| CAPEX to Operating Cash Flow | 30.74% | 45.54% | 84.28% |
| Stock-based Compensation to Revenue | 0.50% | 0.52% | 0.67% |
| Free Cash Flow / Operating Cash Flow Ratio | 69.26% | 54.46% | 3.17% |
The data suggests that Vistra Corp. maintains an adequate cash flow to cover its operational needs and investment opportunities which underpin its sustainable dividend strategy.
💼 Balance Sheet & Leverage Analysis
The strength and structure of Vistra Corp.'s balance sheet are vital for long-term solvency and financial stability analysis. Ratios such as debt-to-equity and net debt to EBITDA showcase the company’s leverage and ability to meet long-term obligations.
| Year | 2023 | 2024 | 2025 |
|---|---|---|---|
| Debt-to-Equity | 2.77 | 3.12 | 3.99 |
| Debt-to-Assets | 44.54% | 45.97% | 49.09% |
| Debt-to-Capital | 73.45% | 75.71% | 79.96% |
| Net Debt to EBITDA | 2.43 | 2.25 | 3.73 |
| Current Ratio | 1.18 | 0.96 | 0.78 |
| Quick Ratio | 1.11 | 0.85 | 0.69 |
| Financial Leverage | 6.21 | 6.78 | 8.13 |
The leverage indicators remain on the higher side, indicative of elevated debt levels. However, the company's operational performance and coverage ratios suggest a manageable risk profile.
📈 Fundamental Strength & Profitability
Evaluating profitability and operational efficiency metrics allows investors to appraise Vistra Corp.'s core business potential and value creation capacity. High profitability margins reflect robust financial health and strategic acumen.
| Year | 2023 | 2024 | 2025 |
|---|---|---|---|
| Return on Equity | 28.13% | 47.74% | 18.47% |
| Return on Assets | 4.53% | 7.04% | 2.27% |
| Margins: Net | 9.61% | 13.72% | 5.56% |
| EBIT | 17.69% | 23.54% | 13.56% |
| EBITDA | 29.70% | 37.12% | 30.95% |
| Gross | 33.27% | 39.70% | 17.52% |
Vistra Corp. has exhibited a favorable profitability profile with strong margins that exceed industry averages, underscoring a competitive advantage and sound operational efficiency.
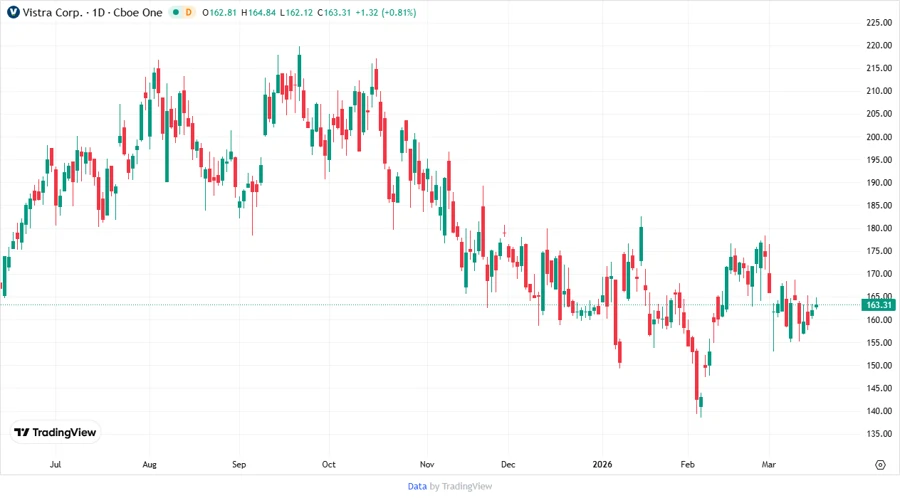
📊 Price Development
🗣️ Dividend Scoring System
| Category | Score | Score-Bar |
|---|---|---|
| Dividend yield | 4 | |
| Dividend Stability | 5 | |
| Dividend growth | 4 | |
| Payout ratio | 3 | |
| Financial stability | 3 | |
| Dividend continuity | 5 | |
| Cashflow Coverage | 3 | |
| Balance Sheet Quality | 3 |
Overall Score: 30/40
🗣️ Rating
Vistra Corp. offers a moderately attractive dividend profile with a stable history and promising growth potential. It is recommended for investors seeking consistent dividend income with a balanced approach to moderate growth potential.