February 17, 2026 a 12:46 pm

VST: Dividend Analysis - Vistra Corp.
Vistra Corp., an influential player in the energy sector, offers a promising dividend profile capturing investors' attention. With a solid dividend growth rate over the past years, Vistra reflects stability and potential for long-term income generation. Investors may find its moderate payout ratio attractive and indicative of further growth prospects. Careful consideration of financial ratios coupled with a sustainable dividend policy signals a solid investment opportunity.
Overview 📊
Vistra Corp. operates in the energy sector, known for its significant contribution to the market cap and consistent dividend policy. Below are the key metrics:
| Metric | Value |
|---|---|
| Sector | Energy |
| Dividend yield | 0.56% |
| Current dividend per share | 1.39 USD |
| Dividend history | 8 years |
| Last cut or suspension | 2019 |
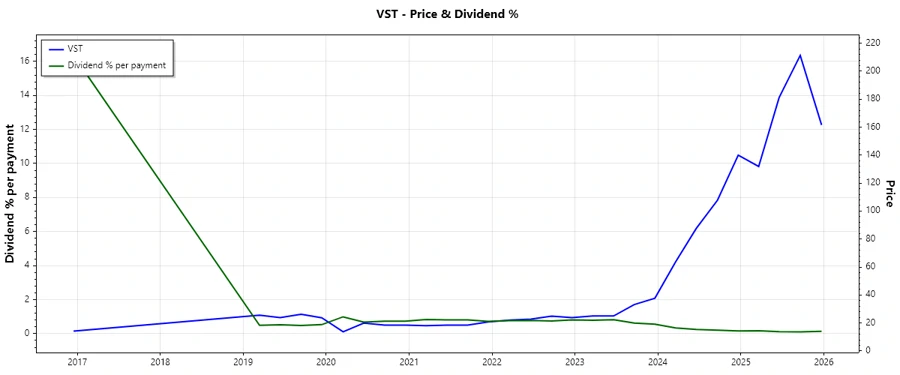
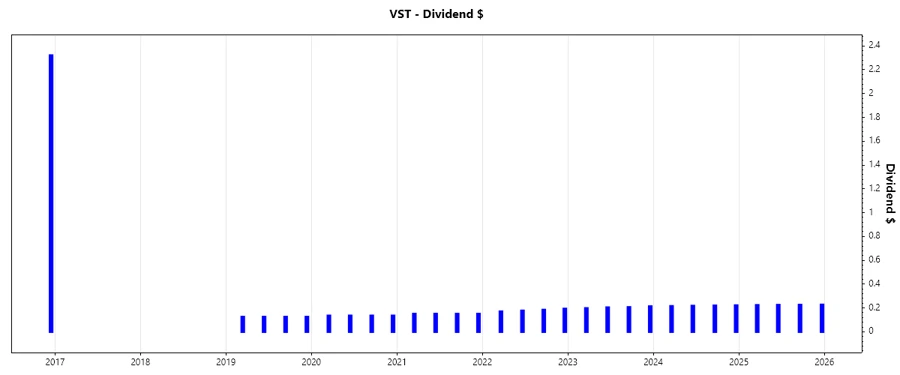
Dividend History 📈
Vistra's growing dividend history reflects its commitment to returning value to shareholders. Tracking historical payouts can give a glimpse of future dividend policy effectiveness.
| Year | Dividend per Share (USD) |
|---|---|
| 2025 | 0.9015 |
| 2024 | 0.8735 |
| 2023 | 0.8205 |
| 2022 | 0.7240 |
| 2021 | 0.6000 |
Dividend Growth 📈
Dividend growth indicates the management's ability to increase dividends, supporting a policy of regular increments. Analyzing this can guide expectations about future payments.
| Time | Growth |
|---|---|
| 3 years | 7.58% |
| 5 years | 10.79% |
The average dividend growth is 10.79% over 5 years. This shows moderate but steady dividend growth.
Payout Ratio 🗣️
Payout ratios reflect the proportion of earnings distributed as dividends, indicating financial capacity and sustainability of the dividend policy.
| Key figure | Ratio |
|---|---|
| EPS-based | 40.89% |
| Free cash flow-based | 28.56% |
With a 40.89% payout based on EPS and a 28.56% payout based on free cash flow, Vistra maintains a balanced approach to satisfying shareholders and reinvesting for growth.
Cashflow & Capital Efficiency 📉
Cash flow measures are essential indicators of a company's ability to maintain dividends and reinvest in growth. Capital efficiency assesses the company's asset utilization effectiveness.
| Metric | 2024 | 2023 | 2022 |
|---|---|---|---|
| Free Cash Flow Yield | 5.23% | 26.52% | -8.33% |
| Earnings Yield | 5.59% | 10.48% | -12.52% |
| CAPEX to Operating Cash Flow | 45.54% | 30.74% | 268.25% |
| Stock-based Compensation to Revenue | 0.52% | 0.49% | 0.35% |
| Free Cash Flow / Operating Cash Flow Ratio | 54.46% | 69.26% | -168.25% |
The positive free cash flow yield and operational cash ratios in recent years suggest strong cash flow stability and effective capital use for Vistra.
Balance Sheet & Leverage Analysis 📊
A stable balance sheet suggests financial health and flexibility in leveraging opportunities for growth while maintaining dividend policies.
| Metric | 2024 | 2023 | 2022 |
|---|---|---|---|
| Debt-to-Equity | 3.12 | 2.77 | 2.72 |
| Debt-to-Assets | 46.97% | 44.54% | 40.67% |
| Debt-to-Capital | 75.71% | 73.45% | 73.12% |
| Net Debt to EBITDA | 2.25 | 2.43 | 10.01 |
| Current Ratio | 0.96 | 1.18 | 1.08 |
| Quick Ratio | 0.85 | 1.11 | 1.02 |
| Financial Leverage | 6.78 | 6.21 | 6.69 |
Vistra maintains a robust debt structure with strong coverage ratios, indicating sound financial stability and capacity for maintaining its dividend commitments.
Fundamental Strength & Profitability 📈
These metrics measure Vistra's operational efficacy and profit margins, crucial for sustaining dividends and indicating competitive positioning.
| Metric | 2024 | 2023 | 2022 |
|---|---|---|---|
| Return on Equity | 47.74% | 28.13% | -25.03% |
| Return on Assets | 7.04% | 4.53% | -3.74% |
| Net Margin | 13.72% | 9.61% | -6.88% |
| EBIT Margin | 23.54% | 17.69% | -3.96% |
| EBITDA Margin | 37.12% | 29.70% | 7.21% |
| Gross Margin | 39.70% | 33.27% | 21.38% |
| R&D to Revenue | 0.00% | 0.00% | 0.00% |
Vistra demonstrates strong profitability metrics overall, reflecting effective management and competitive advantage in the energy sector.
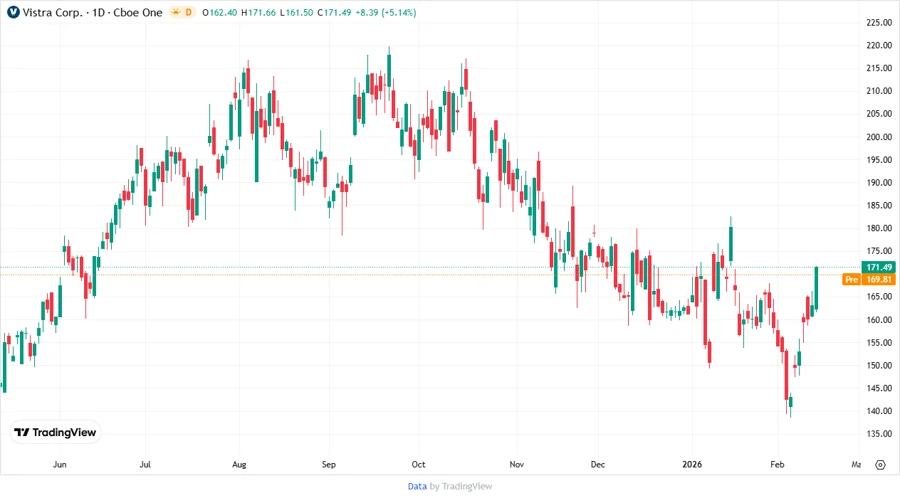
Price Development 📈
Dividend Scoring System 🗣️
An evaluation of Vistra's dividend profile based on several criteria provides a structured understanding of its attractiveness.
| Criteria | Score | Score Bar |
|---|---|---|
| Dividend yield | 2 | |
| Dividend Stability | 4 | |
| Dividend growth | 3 | |
| Payout ratio | 4 | |
| Financial stability | 5 | |
| Dividend continuity | 4 | |
| Cashflow Coverage | 3 | |
| Balance Sheet Quality | 3 |
Total Score: 28/40
Rating ✅
Vistra Corp. presents a compelling balance of growth potential and financial steadiness, with a moderate dividend yield offset by robust stability and clear growth trends. As an investment, it appears suitable for those seeking dependable returns with potential capital appreciation in the energy sector.