November 03, 2025 a 07:47 am

VST: Dividend Analysis - Vistra Corp.
Vistra Corp. presents an intriguing dividend profile with a modest yield balanced by a solid history of consistent payments. The company's strategic focus on growth and efficiency supports its future dividend prospects. Investors should note the stability presented by their dividend history and moderate growth rate.
📊 Overview
Vistra Corp. operates in the Utilities sector and is noted for its steady dividend yield, emphasizing its commitment to returning capital to shareholders. The company's dividend yield, while relatively low, signifies a conservative payout strategy aligned with market conditions.
| Metric | Value |
|---|---|
| Sector | Utilities |
| Dividend Yield | 0.48% |
| Current Dividend Per Share | 1.39 USD |
| Dividend History | 8 years |
| Last Cut/Suspension | 2019 |
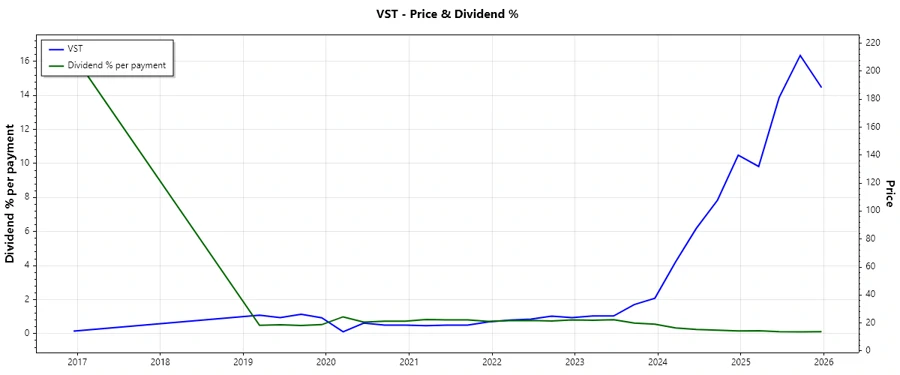
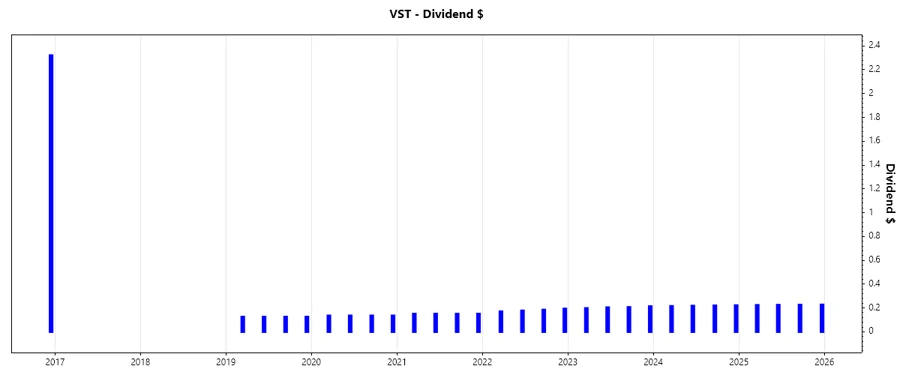
📉 Dividend History
Inspecting Vistra Corp.'s dividend history reveals a disciplined approach to payouts, offering a consistent return to investors. This history is a crucial element for income-focused portfolios.
| Year | Dividend Per Share (USD) |
|---|---|
| 2025 | 0.9015 |
| 2024 | 0.8735 |
| 2023 | 0.8205 |
| 2022 | 0.7240 |
| 2021 | 0.6000 |
📈 Dividend Growth
The growth rate of dividends reveals Vistra Corp.'s potential for significant future returns. This stable growth is indicative of a sustainable business model.
| Time | Growth |
|---|---|
| 3 years | 13.34% |
| 5 years | 11.80% |
The average dividend growth is 11.80% over 5 years. This shows moderate but steady dividend growth.
✅ Payout Ratio
Payout ratios assign great insight into the sustainability of dividend payments. Vistra Corp.'s ratios suggest prudence in payout policies, balancing between profit reinvestment and rewarding shareholders.
| Ratio | Value |
|---|---|
| EPS-based | 19.73% |
| Free Cash Flow-based | 15.10% |
The EPS payout ratio of 19.73% and FCF payout ratio of 15.10% indicate robust sustainability and suggest flexibility for future increases.
Cashflow & Capital Efficiency
Effective cash flow management is paramount for operational success and strategic investments. Vistra Corp.'s financial metrics reflect such efficiencies which ensure stable cash yield continuation.
| Metric | 2024 | 2023 | 2022 |
|---|---|---|---|
| Free Cash Flow Yield | 5.23% | 26.52% | -8.33% |
| Earnings Yield | 5.59% | 10.48% | -12.52% |
| CAPEX to Operating Cash Flow | 45.54% | 30.74% | 268.25% |
| Stock-based Compensation to Revenue | 0.52% | 0.50% | 0.35% |
| Free Cash Flow / Op. Cash Flow Ratio | 54.46% | 69.26% | -168.25% |
Given their cash flow management, Vistra Corp. should maintain sufficient liquidity for future dividend commitments.
Balance Sheet & Leverage Analysis
A robust balance sheet highlights resilience against market fluctuations. Vistra Corp.'s leverage ratios signify an adept handling of debt ensuring financial stability.
| Metric | 2024 | 2023 | 2022 |
|---|---|---|---|
| Debt-to-Equity | 311.74% | 276.69% | 272.05% |
| Debt-to-Assets | 45.97% | 44.54% | 40.67% |
| Debt-to-Capital | 75.71% | 73.45% | 73.12% |
| Net Debt to EBITDA | 2.25 | 2.43 | 10.01 |
| Current Ratio | 0.96 | 1.18 | 1.08 |
| Quick Ratio | 0.85 | 1.11 | 1.02 |
| Financial Leverage | 678.10% | 621.18% | 668.85% |
These leverage figures illustrate Vistra Corp.'s adept managing of financial obligations while leveraging for growth.
Fundamental Strength & Profitability
Analyzing profitability metrics educates on Vistra Corp.'s efficiency in creating value. Such figures are instrumental in projecting future dividend feasibility.
| Metric | 2024 | 2023 | 2022 |
|---|---|---|---|
| Return on Equity | 47.73% | 28.13% | -25.03% |
| Return on Assets | 7.04% | 4.53% | -3.74% |
| Net Margin | 13.72% | 9.61% | -6.88% |
| EBIT Margin | 23.54% | 17.69% | -3.96% |
| EBITDA Margin | 37.12% | 29.70% | 7.22% |
| Gross Margin | 39.70% | 33.27% | 21.38% |
| R&D to Revenue | 0% | 0% | 0% |
Strong profit margins and ROE/ROA ratios reflect Vistra Corp.'s powerful operational efficiency, vital for long-term viability.
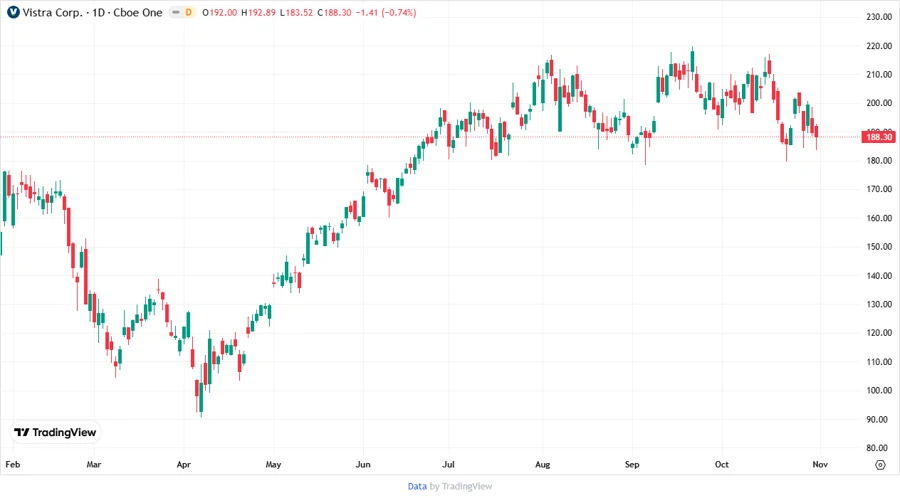
Price Development
⚠️ Dividend Scoring System
| Criteria | Score | Score Bar |
|---|---|---|
| Dividend Yield | 2 | |
| Dividend Stability | 4 | |
| Dividend Growth | 3 | |
| Payout Ratio | 5 | |
| Financial Stability | 3 | |
| Dividend Continuity | 4 | |
| Cashflow Coverage | 3 | |
| Balance Sheet Quality | 4 |
Overall Score: 28/40
🗣️ Rating
Vistra Corp. stands out as a persistently reliable dividend entity with moderate growth potential. Despite its modest yield, its consistent history and manageable payout ratios appeal to long-term investors seeking stability with growing returns. Strategic considerations and market dynamics favor maintaining or expanding positions within the stock.
Smart Data Insight
Master the Perfect Entry & Exit for this Stock
Don't leave your profits to chance. Historically, this stock follows specific seasonal patterns that institutional traders use to maximize returns.
- ✅ Identify the "Golden Buying Window"
- ✅ Avoid high-risk correction cycles
- ✅ Backtested data from the last 20+ years