May 01, 2026 a 11:30 am

VRT: Dividend Analysis - Vertiv Holdings Co
Vertiv Holdings Co presents a distinctive investment opportunity characterized by a modest dividend yield complemented by a commitment to consistent growth in shareholder returns. With a dividend history extending over 7 years, the company has demonstrated resilience in maintaining its payouts even amid fluctuating market dynamics. However, its yield of approximately 0.07% suggests a conservative approach to dividend distribution, prioritizing growth and reinvestment.
Overview 📊
Vertiv Holdings Co is positioned within a dynamic sector, showcasing a dividend yield of 0.07%. It currently offers a dividend per share of $0.17, maintaining dividends over a 7-year period with no recent cuts or suspensions.
| Metric | Value |
|---|---|
| Sector | Not Provided |
| Dividend yield | 0.07% |
| Current dividend per share | $0.17 USD |
| Dividend history | 7 years |
| Last cut or suspension | None |
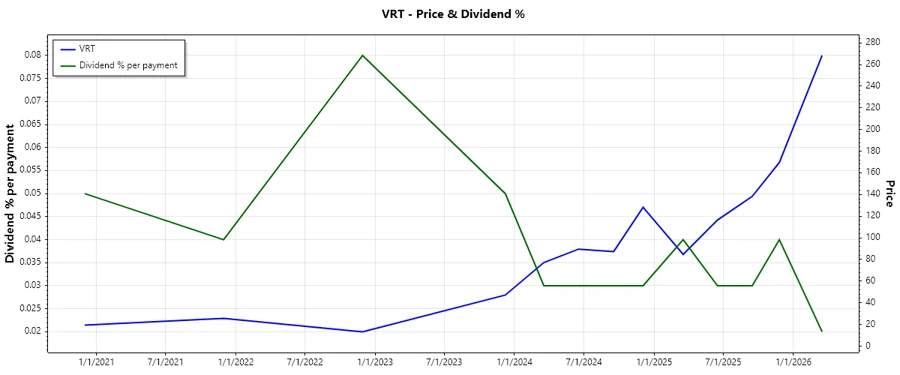
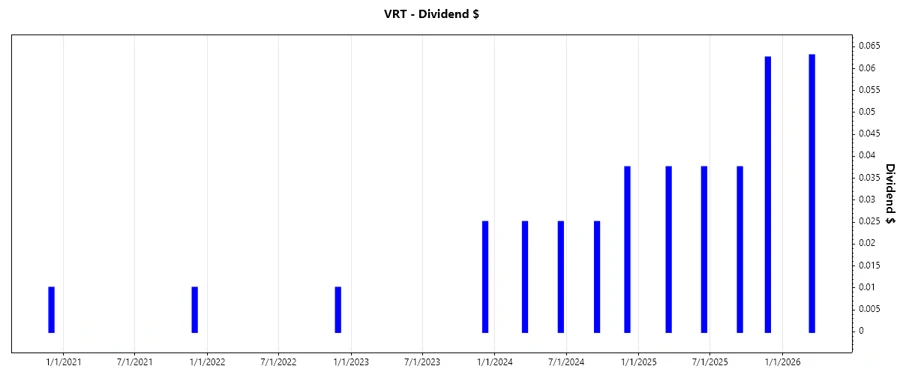
Dividend History 📉
Understanding the history of dividend payments is crucial for assessing the reliability and consistency of a company's dividend strategy. Vertiv's history showcases its commitment to returning value to shareholders despite external pressures.
| Year | Dividend per Share (USD) |
|---|---|
| 2026 | 0.063 |
| 2025 | 0.1750 |
| 2024 | 0.1125 |
| 2023 | 0.025 |
| 2022 | 0.01 |
Dividend Growth 📈
The growth of dividends is indicative of a company's ability to increase shareholder returns over time. Vertiv's average growth of approximately 1.60% over 3 years and 0.77% over 5 years signifies stable growth, highlighting its potential for long-term value increase.
| Time | Growth |
|---|---|
| 3 years | 1.60 % |
| 5 years | 0.77 % |
The average dividend growth is 0.77% over 5 years. This shows moderate but steady dividend growth.
Payout Ratio ⚠️
Payout ratios provide insight into the sustainability of a dividend policy. Vertiv maintains prudent payout ratios of 4.29% based on EPS and 2.90% based on free cash flow, suggesting ample room for reinvestment.
| Key figure | Ratio |
|---|---|
| EPS-based | 4.29 % |
| Free cash flow-based | 2.90 % |
The low EPS payout ratio of 4.29% and FCF payout ratio of 2.90% indicate a conservative approach, allowing flexibility for future growth and stability.
Cashflow & Capital Efficiency ✅
Effective cash flow management and capital efficiency are pivotal in supporting durable dividend policies and reinvestment strategies. Vertiv's metrics reflect sustainable practices, ensuring a robust financial foundation.
| Year | 2025 | 2024 | 2023 |
|---|---|---|---|
| Free Cash Flow Yield | 3.06% | 2.65% | 4.19% |
| Earnings Yield | 2.16% | 1.16% | 2.52% |
| CAPEX to Operating Cash Flow | 11.29% | 13.95% | 14.95% |
| Stock-based Compensation to Revenue | 0.45% | 0.43% | 0.36% |
| Free Cash Flow / Operating Cash Flow Ratio | 89.59% | 86.05% | 85.05% |
Stable cash flow generation alongside efficient use of capital supports Vertiv's strategic options for further investment and shareholder returns.
Balance Sheet & Leverage Analysis 📊
Analyzing balance sheet health and leverage provides insights into financial risk and liquidity management. Vertiv reflects a balanced approach in leveraging debt to optimize financial performance.
| Year | 2025 | 2024 | 2023 |
|---|---|---|---|
| Debt-to-Equity | 0.86 | 1.36 | 1.55 |
| Debt-to-Assets | 0.28 | 0.36 | 0.39 |
| Debt-to-Capital | 0.46 | 0.57 | 0.61 |
| Net Debt to EBITDA | 0.76 | 1.75 | 2.28 |
| Current Ratio | 1.55 | 1.65 | 1.74 |
| Quick Ratio | 1.22 | 1.25 | 1.35 |
| Financial Leverage | 3.10 | 3.75 | 3.97 |
Vertiv's strategic leveraging and robust liquidity underscore its capability to support ongoing operations and strategic expansion.
Fundamental Strength & Profitability 🗣️
Profitability and operational efficacies inform potential returns on investment and shareholder value. Vertiv's strong profitability ratios reflect competent management and growth potential.
| Year | 2025 | 2024 | 2023 |
|---|---|---|---|
| Return on Equity | 33.82% | 20.37% | 22.84% |
| Return on Assets | 10.91% | 5.43% | 5.75% |
| Net Margin | 13.03% | 6.19% | 6.71% |
| EBIT Margin | 18.54% | 11.43% | 10.97% |
| EBITDA Margin | 21.56% | 14.89% | 14.92% |
| Gross Margin | 34.36% | 34.36% | 32.33% |
| R&D to Revenue | 2.96% | 4.39% | 4.42% |
Consistently positive returns on equity and assets depict Vertiv as a profitable entity with strong operational positioning.
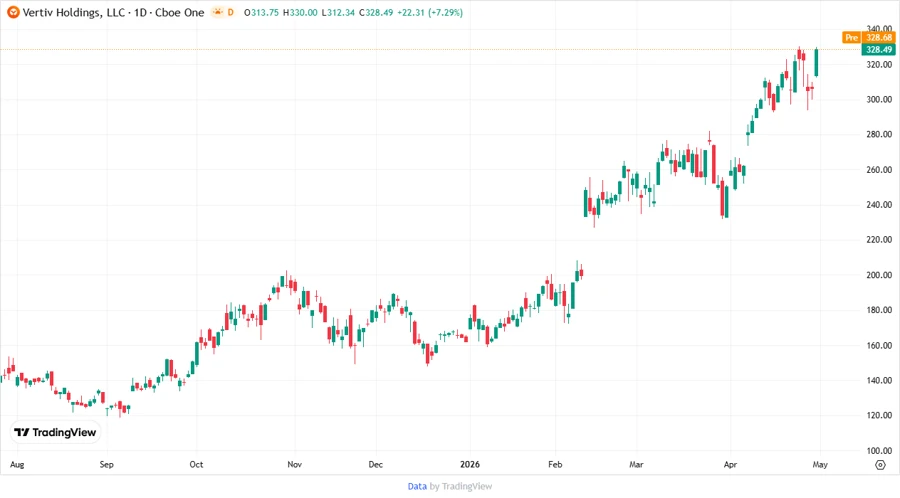
Price Development 📈
Dividend Scoring System ⚖️
| Criteria | Score | Visual |
|---|---|---|
| Dividend yield | 1 | |
| Dividend Stability | 4 | |
| Dividend growth | 3 | |
| Payout ratio | 5 | |
| Financial stability | 4 | |
| Dividend continuity | 4 | |
| Cashflow Coverage | 4 | |
| Balance Sheet Quality | 4 |
Total Score: 29/40
Rating ⭐
Vertiv Holdings Co exhibits a balanced dividend strategy characterized by solid growth potential and financial stability, although the low current yield may not appeal to yield-focused investors. The company's strong fundamentals and responsible payout ratios present a compelling investment for those valuing sustainability and prudent growth. Overall, it is rated as a prudent investment for long-term growth with moderate dividends.