August 27, 2025 a 09:03 am

VRTX: Trend and Support & Resistance Analysis - Vertex Pharmaceuticals Incorporated
Vertex Pharmaceuticals, primarily known for its cystic fibrosis treatments, presents a unique market opportunity in the biotechnology sector. The stock has shown varied performance in recent months, and understanding its trend and crucial price levels can provide insights for investors. Depending on the trend direction and support-resistance zones, strategic trading opportunities may arise, especially considering the company's active clinical trial pipeline. This analysis aims to dissect the price movements and potential zones that could serve as critical trading benchmarks.
Trend Analysis
Analyzing the recent price data of Vertex Pharmaceuticals Incorporated reveals significant insights into its trend direction. By calculating the 20-day and 50-day Exponential Moving Averages (EMA20 and EMA50), we can determine the predominant trend in the examined period. Based on the most recent data:
| Date | Close Price | Trend |
|---|---|---|
| 2025-08-26 | $387.18 | ▼ |
| 2025-08-25 | $388.94 | ▼ |
| 2025-08-22 | $395.12 | ▼ |
| 2025-08-21 | $397.46 | ▼ |
| 2025-08-20 | $394.36 | ▼ |
| 2025-08-19 | $390.76 | ▼ |
| 2025-08-18 | $389.88 | ▼ |
The current trend for VRTX can be identified as a clear downtrend, indicated by the EMA20 falling below the EMA50. This signals a bearish sentiment among investors, likely triggered by recent market events or company-specific news.
Support and Resistance
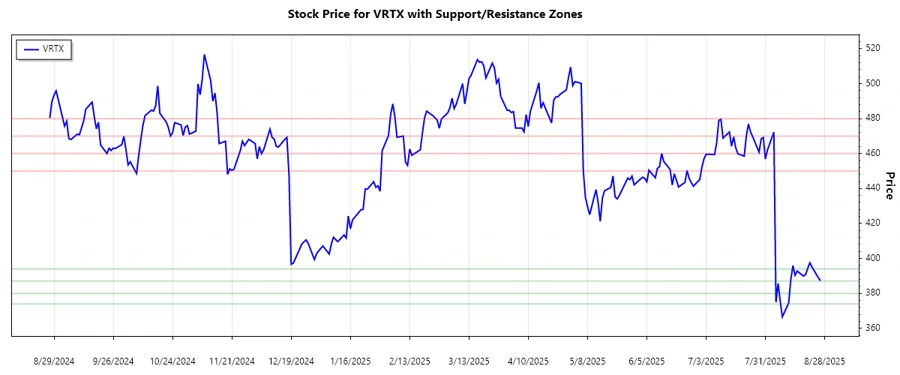
Support and resistance levels play a critical role in technical analysis, serving as potential price points for market reversal or continuation. Vertex Pharmaceuticals' recent data indicates the following zones:
| Zone Type | From | To |
|---|---|---|
| Support 1 | $387.00 | $394.00 |
| Support 2 | $374.00 | $380.00 |
| Resistance 1 | $450.00 | $460.00 |
| Resistance 2 | $470.00 | $480.00 |
Currently, the price of VRTX is within the lower support zone, suggesting potential buying interest could emerge. If maintained, this might indicate an opportunity for tactical accumulation; otherwise, a breach could exacerbate a bearish slide.
Conclusion
The analysis of Vertex Pharmaceuticals suggests a short-term bearish outlook due to prevailing market dynamics, as evidenced by the current downtrend direction. Monitoring how VRTX interacts with defined support and resistance levels is crucial for strategizing entry and exit points. Despite recent downward pressure, the diverse pipeline and strategic collaborations may provide a long-term upside. Investors should remain vigilant regarding new developments, as they could significantly influence stock trajectory. Technical analysis remains a powerful tool in understanding and potentially capitalizing on Vertex Pharmaceuticals' stock movements.
Smart Data Insight
Master the Perfect Entry & Exit for this Stock
Don't leave your profits to chance. Historically, this stock follows specific seasonal patterns that institutional traders use to maximize returns.
- ✅ Identify the "Golden Buying Window"
- ✅ Avoid high-risk correction cycles
- ✅ Backtested data from the last 20+ years