May 12, 2026 a 04:44 pm
VRTX: Fibonacci Analysis - Vertex Pharmaceuticals Incorporated
Vertex Pharmaceuticals Incorporated (VRTX) has shown significant movements recently. Given the company's strong presence in the biotechnology sector, specializing in therapies for cystic fibrosis, the stock has been of particular interest to investors. In analyzing recent trends, key price levels suggest potential areas of support and resistance. As we delve into the Fibonacci retracement analysis, understanding these levels will offer insights into future price actions.
Fibonacci Analysis
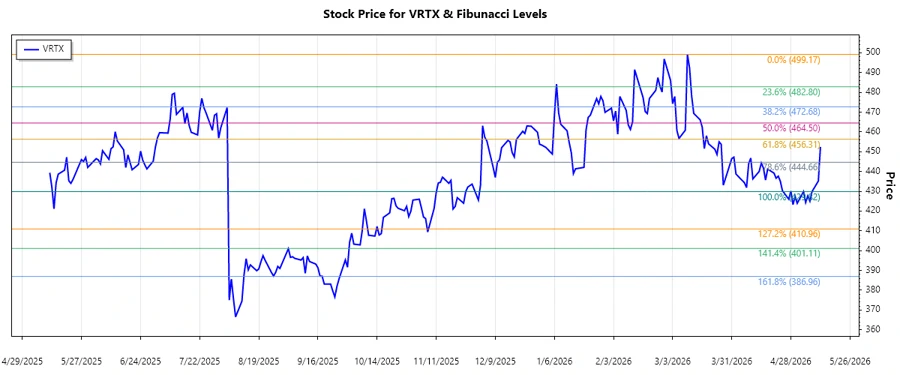
The analysis of Vertex Pharmaceuticals Incorporated (VRTX) reveals a downward trend over the past few months, with significant price movements. Let's delve into the Fibonacci retracement levels and what they mean for this stock.
| Details | Information |
|---|---|
| Start Date | 2026-03-10 |
| End Date | 2026-05-12 |
| High Point (Price & Date) | $499.17 on 2026-03-10 |
| Low Point (Price & Date) | $429.82 on 2026-05-08 |
| Current Price | $452.42 |
Fibonacci Retracement Levels
| Level | Price |
|---|---|
| 0.236 | $483.38 |
| 0.382 | $472.91 |
| 0.5 | $464.50 |
| 0.618 | $456.09 |
| 0.786 | $444.35 |
The current price of VRTX is at $452.42, which places it near the 0.786 retracement level. This could serve as a potential support area, indicating a rebound possibility if maintained.
Conclusion
The Fibonacci retracement analysis of VRTX indicates potential support around the current price, which coincides with the 0.786 level. While there are risks inherent with the downward trend, the biotech company's strong product pipeline and its strategic partnerships suggest operational strengths that could bolster its market positioning. Investors may find opportunities to enter at these retracement levels, considering a trend reversal or continuation based on forthcoming market news and fundamentals.
Smart Data Insight
Master the Perfect Entry & Exit for this Stock
Don't leave your profits to chance. Historically, this stock follows specific seasonal patterns that institutional traders use to maximize returns.
- ✅ Identify the "Golden Buying Window"
- ✅ Avoid high-risk correction cycles
- ✅ Backtested data from the last 20+ years