
June 24, 2026 a 01:15 pm
VRSN: Trend and Support & Resistance Analysis - VeriSign, Inc.
VeriSign, Inc. has established itself as a pivotal player in the internet infrastructure space, managing crucial domains and ensuring cybersecurity. As we analyze the stock performance of VRSN, we observe significant movements in recent months. The company's role in global web navigation showcases its potential for steady growth in the internet domain services market. However, potential investors should be aware of market volatility which could impact stock performance.
Trend Analysis
| Date | Close Price | Trend |
|---|---|---|
| 2026-06-23 | 247.22 | ▼ Abwärtstrend |
| 2026-06-22 | 247.69 | ▼ Abwärtstrend |
| 2026-06-18 | 264.64 | ▼ Abwärtstrend |
| 2026-06-17 | 264.92 | ▼ Abwärtstrend |
| 2026-06-16 | 273.87 | ▼ Abwärtstrend |
| 2026-06-15 | 272.96 | ▼ Abwärtstrend |
| 2026-06-12 | 279.89 | ▲ Aufwärtstrend |
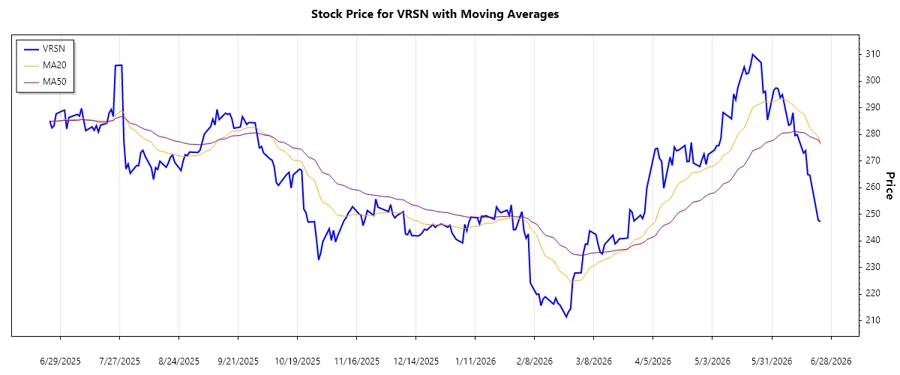
The trend analysis for VeriSign, Inc.'s stock indicates a prevailing downtrend as the EMA20 is consistently lower than the EMA50 over the past few days. This suggests a bearish sentiment among investors, possibly driven by market uncertainties.
Support and Resistance
| Type | Zone From | Zone To |
|---|---|---|
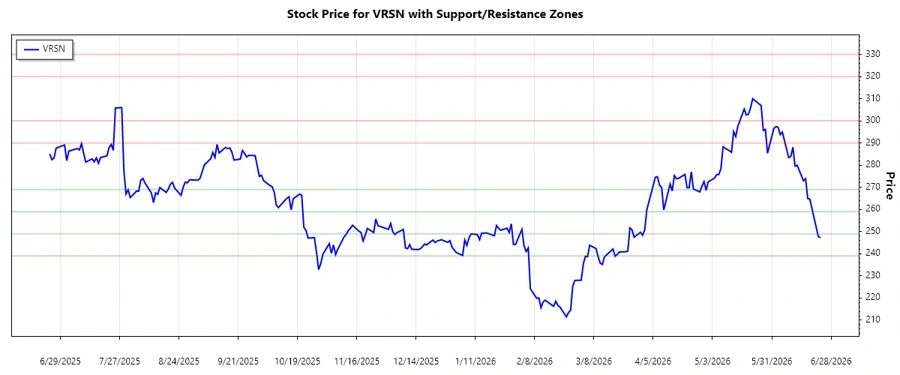
| Support | 269.00 | 259.00 |
| Support | 249.00 | 239.00 |
| Resistance | 290.00 | 300.00 |
| Resistance | 320.00 | 330.00 |
Currently, the stock is hovering slightly above the second support zone. If it breaches this zone, further decline is possible. However, should it bounce back, a test of the immediate resistance might be anticipated.
Conclusion
VeriSign, Inc. exhibits a downward trend recently, marked by a lower EMA20 compared to the EMA50. The stock is close to its support zone, which could provide near-term stability. Despite recent declines, VeriSign's stable business model in critical internet infrastructure might attract long-term investors. However, short-term traders should be cautious of potential dips and market reactions. Monitoring these support and resistance levels can offer insights into potential entry and exit points. As always, ongoing assessment of market conditions and the company's performance remains crucial.
Smart Data Insight
Master the Perfect Entry & Exit for this Stock
Don't leave your profits to chance. Historically, this stock follows specific seasonal patterns that institutional traders use to maximize returns.
- ✅ Identify the "Golden Buying Window"
- ✅ Avoid high-risk correction cycles
- ✅ Backtested data from the last 20+ years