September 26, 2025 a 09:04 am
VRSN: Trend and Support & Resistance Analysis - VeriSign, Inc.
VeriSign, Inc. has shown significant price movement over the analyzed period, reflecting both positive growth indicators and market volatility. The company's stable position in global internet infrastructure provides a fundamental backdrop that supports its current market trends. However, fluctuations in price indicate potential external challenges that might influence investment decisions. Monitoring technical indicators is essential for a more precise understanding of the market behavior affecting VRSN.
Trend Analysis
| Date | Closing Price | Trend |
|---|---|---|
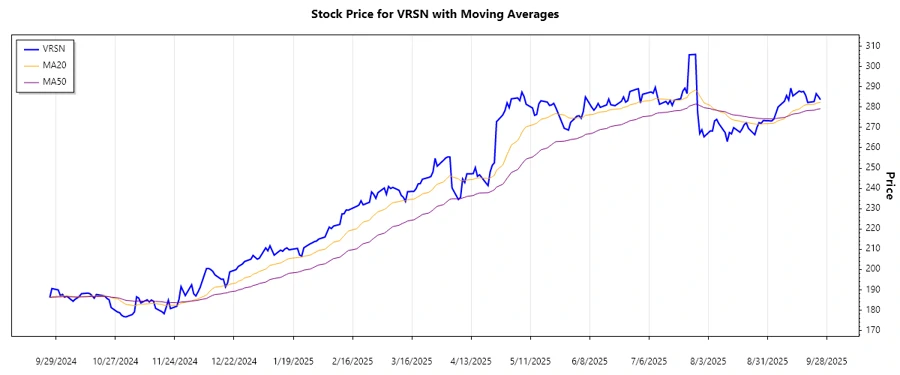
| 2025-09-25 | $283.69 | ▲ Uptrend |
| 2025-09-24 | $285.26 | ▲ Uptrend |
| 2025-09-23 | $286.64 | ▲ Uptrend |
| 2025-09-22 | $282.74 | ▲ Uptrend |
| 2025-09-19 | $282.28 | ▼ Downtrend |
| 2025-09-18 | $285.88 | ▲ Uptrend |
| 2025-09-17 | $287.77 | ▲ Uptrend |
The recent EMA analysis suggests that the stock is in a positive uptrend as the EMA20 is currently above the EMA50. This indicates investor confidence and potential bullish market sentiment.
Support- and Resistance
| Type | Zone Range |
|---|---|
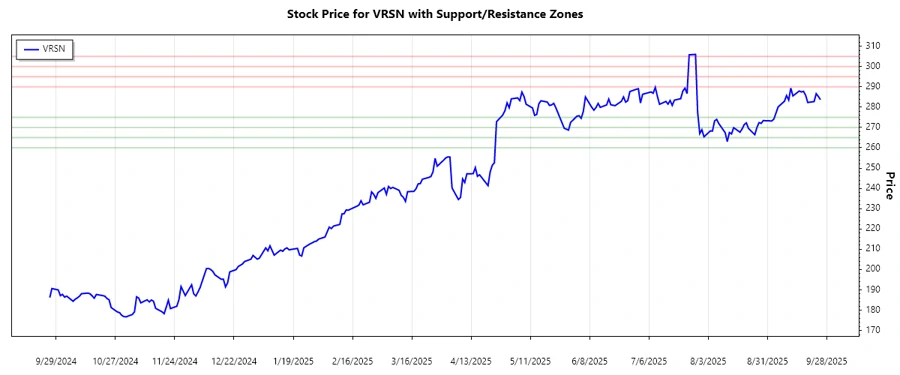
| Support Zone 1 | $270 ▲ - $275 |
| Support Zone 2 | $260 ▲ - $265 |
| Resistance Zone 1 | $290 ▼ - $295 |
| Resistance Zone 2 | $300 ▼ - $305 |
The current closing price is hovering near the upper boundary of the first support zone, which suggests that any downturn could be cushioned by this established price floor.
Conclusion
VeriSign, Inc.'s stock exhibits a positive upward trajectory supported by both technical indicators and fundamental business stability. However, it is essential to consider global economic factors that could introduce volatility. The stock's proximity to support and resistance zones creates opportunities for strategic trading, with a strong possibility for continued growth. Nonetheless, investors should remain cautious about potential pullbacks, particularly if market circumstances change unexpectedly. Analyst vigilance is recommended to take advantage of optimal entry and exit points.
Smart Data Insight
Master the Perfect Entry & Exit for this Stock
Don't leave your profits to chance. Historically, this stock follows specific seasonal patterns that institutional traders use to maximize returns.
- ✅ Identify the "Golden Buying Window"
- ✅ Avoid high-risk correction cycles
- ✅ Backtested data from the last 20+ years