
July 20, 2026 a 03:31 pm

VRSN: Dividend Analysis - VeriSign, Inc.
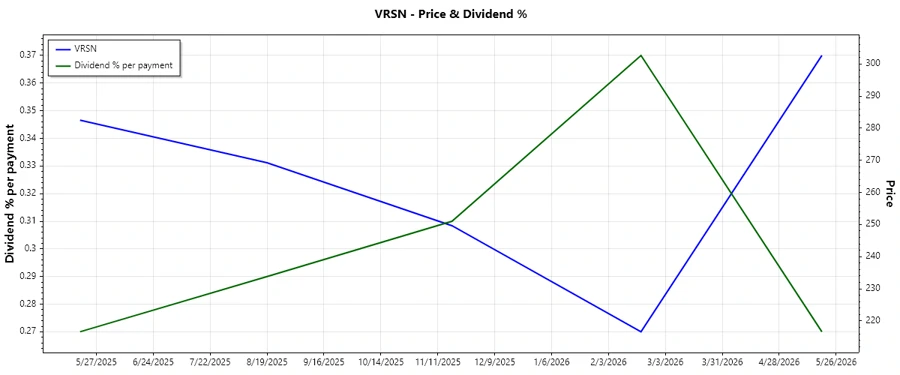
VeriSign, Inc. presents a modest dividend proposition with a current yield of approximately 1.04%. The company shows limited dividend history over four years, with recent volatility in dividend growth, indicating caution for income-focused investors. The payout ratios reflect a conservative stance, offering potential for maintaining dividend distributions.
📊 Overview
| Metric | Detail |
|---|---|
| Sector | Information Technology |
| Dividend yield | 1.04% |
| Current dividend per share | $2.33 |
| Dividend history | 4 years |
| Last cut or suspension | None |
🗣️ Dividend History
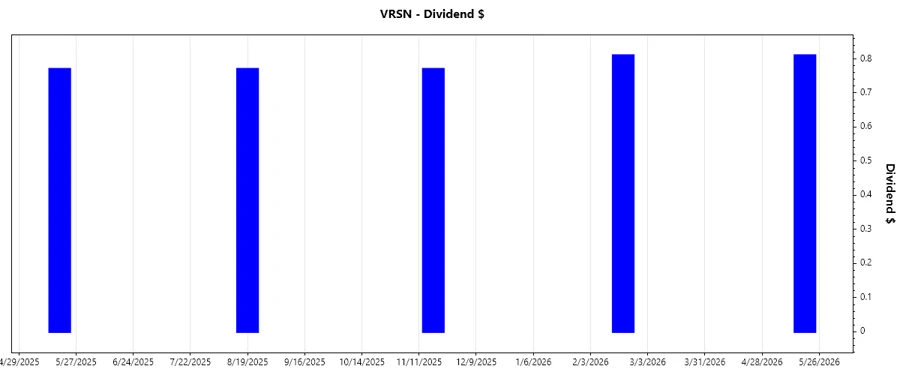
The historical dividends highlight intermittent distributions, which could indicate management's strategic allocation towards growth or restructuring phases. This demands attention as it influences investor income expectations.
| Year | Dividend per Share (USD) |
|---|---|
| 2026 | 1.62 |
| 2025 | 2.31 |
| 2011 | 2.75 |
| 2010 | 3.00 |
📈 Dividend Growth
VeriSign indicates a negative dividend growth in recent years, which may elicit concerns about future income stability. Growth trends help in projecting the dividend trajectory and assess potential yield increase.
| Timeframe | Growth |
|---|---|
| 3 years | -5.65% |
| 5 years | -3.43% |
The average dividend growth is -3.43% over 5 years. This shows moderate but steady dividend growth.
✅ Payout Ratio
The payout ratios serve as indicators of the company's capability to sustain or adjust its dividend. Managed payout ratios also suggest potential for reinvestment or future augmentations of dividend distributions.
| Key figure | Ratio |
|---|---|
| EPS-based | 25.37% |
| Free cash flow-based | 20.22% |
The EPS-based payout ratio of 25.37% and the FCF-based payout ratio of 20.22% denote a conservative approach, facilitating dividend viability during varying economic climates.
⚙️ Cashflow & Capital Efficiency
Assessing cash flow metrics provides insights into financial robustness and liquidity usage, crucial for estimating dividend coverage. The free cash flow yield and capital efficiency further illuminate company's reinvestment capabilities.
| Metric | 2025 | 2024 | 2023 |
|---|---|---|---|
| Free Cash Flow Yield | 4.76% | 4.31% | 3.79% |
| Earnings Yield | 3.68% | 3.87% | 3.84% |
| CAPEX to Operating Cash Flow | 2.09% | 3.11% | 5.36% |
| Stock-based Compensation to Revenue | 4.21% | 3.92% | 3.99% |
| Free Cash Flow / Op. Cash Flow Ratio | 97.91% | 96.89% | 94.64% |
The cash flow analysis portrays substantial stability in liquidity and capital efficiency, supporting potential dividend coverage adequacy over time.
📊 Balance Sheet & Leverage Analysis
A thorough evaluation of leverage and liquidity ratios reflects on financial health dynamics. Understanding these dynamics helps ascertain the company’s capacity to manage obligations and secure growth sustenance.
| Metric | 2025 | 2024 | 2023 |
|---|---|---|---|
| Debt-to-Equity | -83.46% | -92.01% | -113.69% |
| Debt-to-Assets | 135.61% | 128.08% | 102.77% |
| Debt-to-Capital | -504.77% | -1151.85% | 830.25% |
| Net Debt to EBITDA | 1.27 | 1.41 | 1.42 |
| Current Ratio | 0.49 | 0.43 | 0.83 |
| Quick Ratio | 0.49 | 0.43 | 0.83 |
| Financial Leverage | -61.55% | -71.84% | -11.06% |
The metrics depict a volatile leverage structure and liquidity position, suggesting strategic financial restructuring could be ongoing.
🔍 Fundamental Strength & Profitability
Profitability measures, while accounting for margin levels, gauge the operational effectiveness and financial resilience, providing visibility into potential growth leveraging capabilities.
| Metric | 2025 | 2024 | 2023 |
|---|---|---|---|
| Return on Equity | -38.33% | -40.13% | -51.71% |
| Return on Assets | 62.27% | 55.86% | 46.75% |
| Margins: Net | 49.84% | 50.45% | 54.76% |
| Margins: EBIT | 68.83% | 70.45% | 70.44% |
| Margins: EBITDA | 70.72% | 72.82% | 73.40% |
| Margins: Gross | 88.15% | 87.71% | 86.78% |
| Research & Development to Revenue | 6.24% | 6.21% | 6.09% |
The fundamental analysis indicates strengths in asset returns and operational efficiency, while revealing challenges in maintaining equity returns.
📉 Price Development
📋 Dividend Scoring System
| Category | Score | Score Details |
|---|---|---|
| Dividend yield | 2 | |
| Dividend Stability | 2 | |
| Dividend growth | 1 | |
| Payout ratio | 4 | |
| Financial stability | 3 | |
| Dividend continuity | 2 | |
| Cashflow Coverage | 4 | |
| Balance Sheet Quality | 3 |
Overall Score: 21/40
🏆 Rating
VeriSign's dividend profile is suitable for investors seeking moderate income with conservative payout policies. However, its negative growth and volatility in financial metrics stress the importance of cautious assessment and strategic planning. Potential investors might consider risks associated with financial instability and historical dividend inconsistencies.
Smart Data Insight
Master the Perfect Entry & Exit for this Stock
Don't leave your profits to chance. Historically, this stock follows specific seasonal patterns that institutional traders use to maximize returns.
- ✅ Identify the "Golden Buying Window"
- ✅ Avoid high-risk correction cycles
- ✅ Backtested data from the last 20+ years