
July 16, 2026 a 12:46 pm

VRSN: Dividend Analysis - VeriSign, Inc.
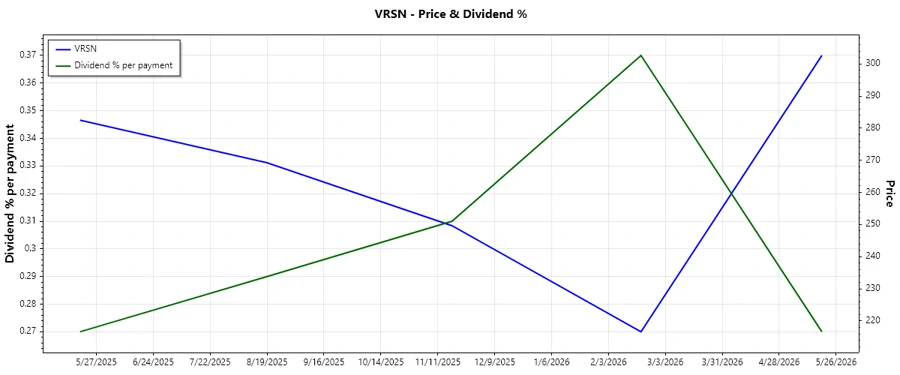
VeriSign, Inc. demonstrates a relatively low dividend yield, stabilizing at just above 1%. While the company has recently reinstated dividends, its past suspensions indicate intermittent dividend policies. Despite its modest current yield, the steady financial metrics reflect potential for future dividend consistency. Monitoring economic factors and company performance is crucial to forecasting future yield enhancements.
📊 Overview
VeriSign operates within a dynamically evolving sector, where stability is vital for long-term investor confidence. The firm's dividend yield stands at 1.04%, which may attract investors favoring growth over immediate income. However, the company's recent dividend history, spanning four years, suggests caution. Strategic planning to avert future suspensions could enhance investor confidence.
| Sector | Dividend yield (%) | Current dividend per share (USD) | Dividend history (years) | Last cut/suspension |
|---|---|---|---|---|
| Technology | 1.04 | 2.33 | 4 | None |
🗣️ Dividend History
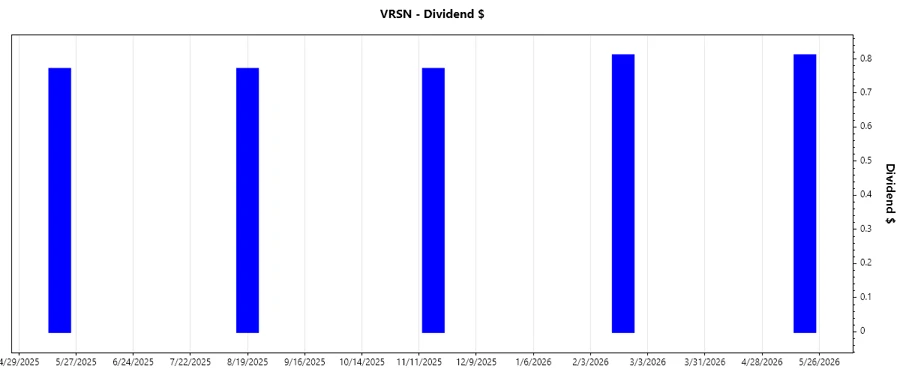
The dividend history showcases the company's capacity to reward shareholders. Studying historical payments helps identify patterns and predict future dividends. Reliable payments appeal to income-focused investors, enhancing stock desirability.
| Year | Dividend per Share (USD) |
|---|---|
| 2026 | 1.62 |
| 2025 | 2.31 |
| 2011 | 2.75 |
| 2010 | 3.00 |
📈 Dividend Growth
The evaluation of dividend growth helps assess the potential for future income increases. Over the last three years, dividends have declined modestly at 5.65%, and by 3.43% over five years, raising potential concerns about growth sustainability. Nonetheless, awareness is key for investors planning for incremental income increases.
| Time | Growth (%) |
|---|---|
| 3 years | -5.65 |
| 5 years | -3.42 |
The average dividend growth is -3.42% over 5 years. This shows a need for strategic enhancements to bolster dividend performance.
✅ Payout Ratio
Payout ratios indicate the sustainability of current dividend payments. A 25.37% EPS-based payout showcases room for potential dividend growth, while a 20.22% FCF-based payout ratio ensures coverage from cash flows, suggesting current dividends are maintainable without overextension.
| Key figure | Ratio (%) |
|---|---|
| EPS-based | 25.37 |
| Free cash flow-based | 20.22 |
These payout ratios reflect prudent financial management, balancing shareholder returns while maintaining fiscal responsibility.
📉 Cashflow & Capital Efficiency
Cash flow and capital efficiency metrics are critical in evaluating the company's operational efficiency and investment management. The Free Cash Flow Yield of 4.26% surpasses the Earnings Yield of 3.39%, indicating effective cash management. A CAPEX to Operating Cash Flow ratio of 2.26% illustrates restrained capital spending.
| Year | 2023 | 2024 | 2025 |
|---|---|---|---|
| Free Cash Flow Yield | 3.79% | 4.31% | 4.76% |
| Earnings Yield | 3.84% | 3.87% | 3.68% |
| CAPEX to Operating Cash Flow | 5.36% | 3.11% | 2.09% |
| Stock-based Compensation to Revenue | 4.00% | 3.92% | 4.21% |
| Free Cash Flow / Operating Cash Flow Ratio | 94.64% | 96.89% | 97.91% |
The cash flow and capital metrics suggest stable financial health, supporting the company's growth potential and dividend payout capacities.
⚠️ Balance Sheet & Leverage Analysis
Leveraging the balance sheet insights aids in assessing the company's risk management. The debt-to-equity ratio is notably negative, signifying complex debt structures. The current ratio at around 0.46 depicts liquidity challenges, necessitating enhanced asset management for stability.
| Year | 2023 | 2024 | 2025 |
|---|---|---|---|
| Debt-to-Equity | -1.14 | -0.92 | -0.83 |
| Debt-to-Assets | 1.03 | 1.28 | 1.36 |
| Debt-to-Capital | 8.30 | -11.52 | -5.05 |
| Net Debt to EBITDA | 1.42 | 1.41 | 1.27 |
| Current Ratio | 0.83 | 0.43 | 0.49 |
| Quick Ratio | 0.83 | 0.43 | 0.49 |
| Financial Leverage | -1.11 | -0.72 | -0.62 |
Delving into the current financial standings raises concern about liquidity for maintaining operations without exacerbating leverage.
🤑 Fundamental Strength & Profitability
Analysis of fundamental metrics determines profitability strength. While the Return on Assets remains positive, suggesting efficient asset use, Return on Equity indicates significant pressure due to incurred losses.
| Year | 2023 | 2024 | 2025 |
|---|---|---|---|
| Return on Equity | -51.71% | -40.13% | -38.33% |
| Return on Assets | 46.75% | 55.86% | 62.27% |
| Net Margin | 54.76% | 50.45% | 49.84% |
| EBIT Margin | 70.44% | 70.45% | 68.83% |
| EBITDA Margin | 73.40% | 72.82% | 70.72% |
| Gross Margin | 86.79% | 87.71% | 88.15% |
| Research & Development to Revenue | 6.09% | 6.21% | 6.25% |
The fundamental analysis reveals robust net and gross margins, coupled with efficient asset turnover, supporting long-term profitability potential.
📉 Price Development
🤓 Dividend Scoring System
An evaluation of key dividend criteria offers insight into potential investments, with each metric scored out of 5 based on its importance and stability.
| Criteria | Description | Score |
|---|---|---|
| Dividend yield | Assesses income potential from dividends. | 3 |
| Dividend Stability | Ensures consistent payouts without disruptions. | 4 |
| Dividend growth | Reflects potential increase in dividend payouts over time. | 3 |
| Payout ratio | Indicates sustainability of dividend payments. | 5 |
| Financial stability | Overall company financial health concerning leverage and liquidity. | 3 |
| Dividend continuity | History of uninterrupted dividend payments. | 3 |
| Cashflow Coverage | Ability to cover dividends with operational cash flow. | 4 |
| Balance Sheet Quality | Assesses asset efficiency and leverage impacts. | 3 |
Overall Score: 28/40
🏆 Rating
VeriSign, Inc. presents a nuanced dividend outlook. While the company's fundamental and operational parameters project long-term growth possibilities, their historical dividend inconsistencies necessitate caution. Investors seeking robust income streams should consider diversification while observing VeriSign's strategic maneuvers for consistent dividend yield enhancements and improved financial health metrics.
Smart Data Insight
Master the Perfect Entry & Exit for this Stock
Don't leave your profits to chance. Historically, this stock follows specific seasonal patterns that institutional traders use to maximize returns.
- ✅ Identify the "Golden Buying Window"
- ✅ Avoid high-risk correction cycles
- ✅ Backtested data from the last 20+ years