June 13, 2026 a 09:03 am

VRSK: Trend and Support & Resistance Analysis - Verisk Analytics, Inc.
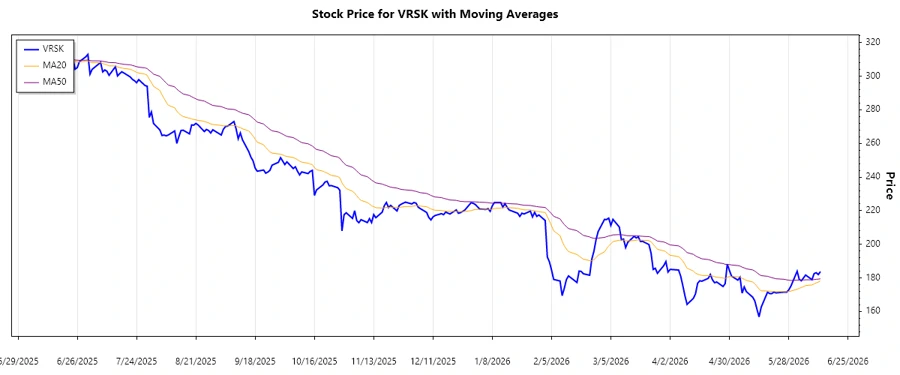
The Verisk Analytics, Inc. (Ticker: VRSK) is experiencing significant price movements influenced by market dynamics in the analytics sector. As a leading provider of data analytics, its stock performance is often reflective of industry trends in risk management and predictive modeling. With recent fluctuations, investors are keenly observing potential supports and resistances to make informed decisions. The company's multifaceted business operations have contributed to a diverse range of influences on its stock price.
Trend Analysis
| Date | Close Price | Trend |
|---|---|---|
| 2026-06-12 | $183.8 | ⚖️ |
| 2026-06-11 | $182 | ▼ |
| 2026-06-10 | $183.13 | ▼ |
| 2026-06-09 | $182.55 | ▼ |
| 2026-06-08 | $178.97 | ▼ |
| 2026-06-05 | $181.73 | ▼ |
| 2026-06-04 | $180 | ▼ |
The recent stock pattern indicates an overall downward trend with EMA20 currently lower than EMA50, signaling investor caution and potential opportunity for short positions. This decline suggests limited bullish momentum in the near term.
Support and Resistance
| Type | Zone Range ($) |
|---|---|
| Resistance | 190 - 195 |
| Resistance | 200 - 205 |
| Support | 175 - 170 |
| Support | 165 - 160 |
Currently, the stock price sits near the support zone of $175-$170, possibly offering an accumulation point for bullish investors. Monitoring volume and price action in these areas will be critical for identifying valid entry and exit points.
Conclusion
Verisk Analytics, Inc. is under short-term selling pressure with a larger downward trend. Key support levels offer potential entry points for long-term investors; however, continued weakness may push prices toward lower support zones. Resistance at higher levels might present challenges for sustained recoveries. Analysts must remain vigilant, as external economic factors might influence these technical areas. Position sizing and risk management are crucial, given the current price level near support.
Smart Data Insight
Master the Perfect Entry & Exit for this Stock
Don't leave your profits to chance. Historically, this stock follows specific seasonal patterns that institutional traders use to maximize returns.
- ✅ Identify the "Golden Buying Window"
- ✅ Avoid high-risk correction cycles
- ✅ Backtested data from the last 20+ years