
July 03, 2026 a 05:15 am
VRSK: Fibonacci Analysis - Verisk Analytics, Inc.
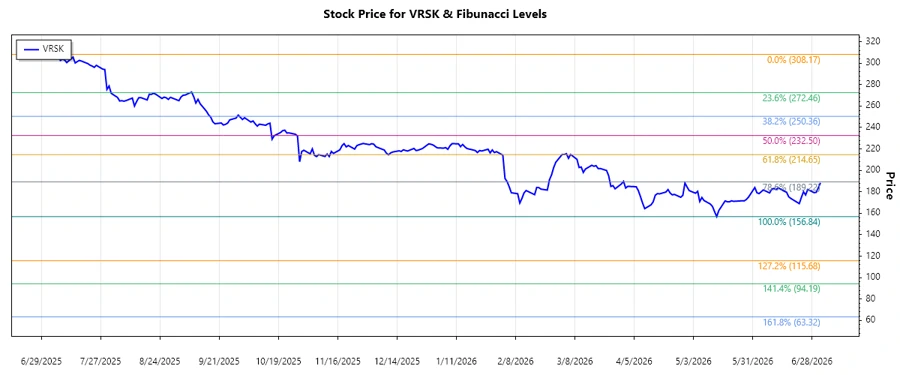
Verisk Analytics, Inc. has exhibited a strong downward trend over the last months, indicative of shifting market dynamics. With the recent price movements, a deeper analysis using Fibonacci retracement can reveal potential support and resistance levels that may guide trading strategies in the coming time.
Fibonacci Analysis
| Start Date | End Date | High (Price/Date) | Low (Price/Date) |
|---|---|---|---|
| 2025-07-03 | 2026-07-02 | $308.17 / 2025-07-07 | $156.84 / 2026-05-14 |
| Retracement Level | Price |
|---|---|
| 0.236 | $190.34 |
| 0.382 | $215.76 |
| 0.5 | $232.51 |
| 0.618 | $249.25 |
| 0.786 | $274.67 |
The current price is around $188.35, positioning the stock within proximity to the 0.236 retracement level, indicating potential resistance.
The proximity to the 0.236 retracement level suggests cautious monitoring as any breakthrough might signal a bullish reversal.
Conclusion
The trend for Verisk Analytics, Inc. shows a clear downtrend with potential reversal signals as prices hover near significant Fibonacci levels. Traders must be wary of continued market momentum, as the stock shows potential support near current levels. While the technical indicators suggest possible recovery opportunities, risk remains prevalent in light of broader market conditions. Strategically, entering positions on confirmed support could offer a favorable risk-reward scenario, although patience may be required to navigate potential volatility in the short term.
Smart Data Insight
Master the Perfect Entry & Exit for this Stock
Don't leave your profits to chance. Historically, this stock follows specific seasonal patterns that institutional traders use to maximize returns.
- ✅ Identify the "Golden Buying Window"
- ✅ Avoid high-risk correction cycles
- ✅ Backtested data from the last 20+ years