
July 14, 2026 a 02:46 am

VRSK: Dividend Analysis - Verisk Analytics, Inc.
Verisk Analytics, Inc., a notable entity in its sector, exhibits a commendable dividend profile characterized by consistent growth and a robust payout strategy. Their sustained dividend history and strategic financial management demonstrate an unwavering commitment to rewarding shareholders. This financial stability and profit-generating capability ensure that Verisk remains a reliable option for dividend-focused investors.
📊 Overview
Verisk Analytics operates within a competitive sector while maintaining a healthy dividend yield. The company's commitment to dividend distribution is evident in its substantial history, showcasing an impressive track record over the years.
| Parameter | Details |
|---|---|
| Sector | Insurance Data Analytics |
| Dividend yield | 1.05% |
| Current dividend per share | 1.81 USD |
| Dividend history | 8 years |
| Last cut or suspension | None |
📉 Dividend History
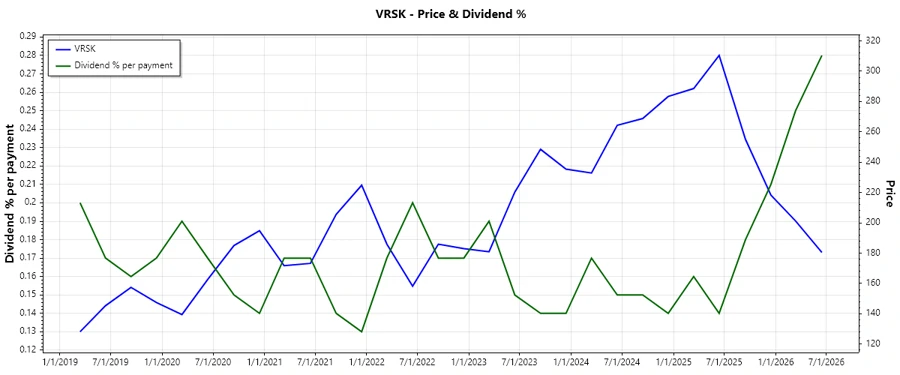
The historical dividend data of Verisk demonstrates a consistent pattern of growth. This stability attracts investors seeking regular income and reflects the company's ability to generate steady cash flows.
| Year | Dividend Per Share (USD) |
|---|---|
| 2026 | 1.00 |
| 2025 | 1.80 |
| 2024 | 1.56 |
| 2023 | 1.36 |
| 2022 | 1.24 |
📈 Dividend Growth
Verisk's dividend growth analysis reveals a gradual upward trajectory, with pronounced growth rates over multiple periods. This trend marks them as a stable player within dividend growth investing.
| Time | Growth |
|---|---|
| 3 years | 13.23% |
| 5 years | 10.76% |
The average dividend growth is 10.76% over 5 years. This shows moderate but steady dividend growth.
✅ Payout Ratio
Payout ratios are pivotal when evaluating a company's dividend sustainability. Lower payout ratios often imply that a company has ample room to sustain its dividend payments through various economic conditions.
| Key figure | Ratio |
|---|---|
| EPS-based | 26.79% |
| Free cash flow-based | 20.99% |
The EPS payout ratio of 26.79% and the free cash flow payout ratio of 20.99% indicate a prudent approach to profit distribution, leaving room for reinvestment and growth.
Cashflow & Capital Efficiency
Examining cash flow yields and capital efficiency metrics provides insight into Verisk's operational effectiveness and liquidity status. These indicators are crucial for assessing a firm's ability to generate profits and thus continue its dividend payment commitments.
| Metric | 2023 | 2024 | 2025 |
|---|---|---|---|
| Free Cash Flow Yield | 2.37% | 2.35% | 3.83% |
| Earnings Yield | 1.75% | 2.45% | 2.92% |
| CAPEX to Operating Cash Flow | 21.68% | 19.57% | 16.99% |
| Stock-based Compensation to Revenue | 2.01% | 1.66% | 1.76% |
| Free Cash Flow / Operating Cash Flow Ratio | 78.32% | 80.43% | 83.00% |
The varied but improving Free Cash Flow Yield suggests growing operational leverage, essential for sustaining and potentially increasing future dividend payments.
Balance Sheet & Leverage Analysis
A robust balance sheet coupled with prudent leverage is indicative of financial stability, which mitigates risks associated with high debt levels and ensures the capacity to honour dividends.
| Metric | 2023 | 2024 | 2025 |
|---|---|---|---|
| Debt-to-Equity | 9.99 | 32.43 | 16.30 |
| Debt-to-Assets | 70.90% | 76.11% | 81.31% |
| Debt-to-Capital | 90.90% | 97.01% | 94.20% |
| Net Debt to EBITDA | 1.96 | 1.78 | 1.69 |
| Current Ratio | 1.05 | 0.74 | 1.20 |
| Quick Ratio | 1.05 | 0.74 | 1.20 |
| Financial Leverage | 14.08 | 42.60 | 20.05 |
Despite high leverage, Verisk maintains a strong balance sheet essential for capital preservation and enabling ongoing dividend distributions.
Fundamental Strength & Profitability
Evaluating profitability metrics such as return on equity and margins offers insight into operational success, strategic advantage, and potential for sustained profitability which are critical for dividend robustness.
| Metric | 2023 | 2024 | 2025 |
|---|---|---|---|
| Return on Equity | 1.98% | 9.57% | 2.94% |
| Return on Assets | 0.14% | 0.22% | 0.15% |
| Net Margin | 22.91% | 33.23% | 29.56% |
| EBIT Margin | 42.62% | 46.96% | 44.91% |
| EBITDA Margin | 53.11% | 57.57% | 54.95% |
| Gross Margin | 67.31% | 68.73% | 67.31% |
Verisk's profitability metrics underline robust operational efficiency, implying substantial cash flow generation to support and potentially increase dividends.
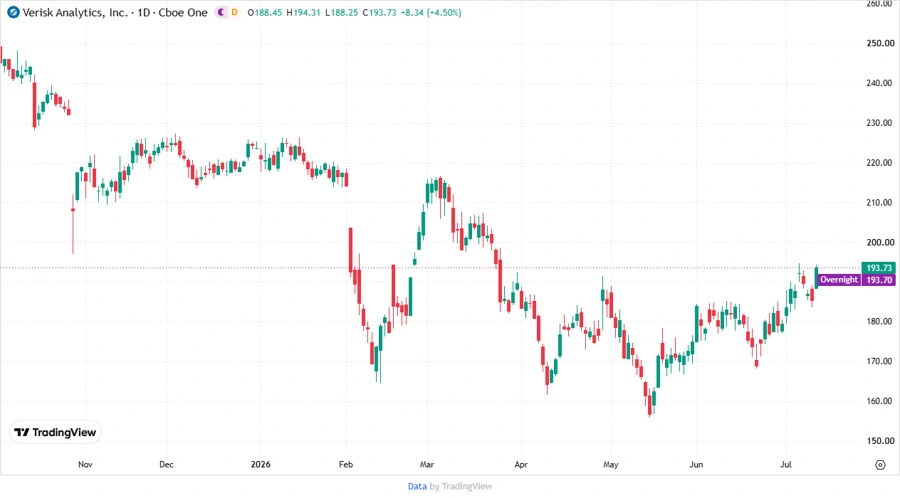
📈 Price Development
🗣️ Dividend Scoring System
| Category | Score | Details |
|---|---|---|
| Dividend yield | 3 | |
| Dividend Stability | 4 | |
| Dividend growth | 4 | |
| Payout ratio | 5 | |
| Financial stability | 3 | |
| Dividend continuity | 5 | |
| Cashflow Coverage | 4 | |
| Balance Sheet Quality | 3 |
Overall Score: 31/40
⚠️ Rating
Verisk Analytics, Inc. exhibits a resilient dividend performance through measured growth, consistent payouts, and sound financial backing. Prospective investors focused on steady income could view Verisk favorably, although considerations of market conditions and diversification must remain paramount.
Smart Data Insight
Master the Perfect Entry & Exit for this Stock
Don't leave your profits to chance. Historically, this stock follows specific seasonal patterns that institutional traders use to maximize returns.
- ✅ Identify the "Golden Buying Window"
- ✅ Avoid high-risk correction cycles
- ✅ Backtested data from the last 20+ years