May 17, 2026 a 02:46 am

VRSK: Dividend Analysis - Verisk Analytics, Inc.
Verisk Analytics, Inc. is a prominent player in the analytics sector with a moderate dividend yield of 1.17%. Its steady and consistent dividend history of 8 years signifies a commitment to rewarding shareholders, though its historic growth rate appears moderate. Analysis of payout ratios and historical financial performance indicates a balanced approach to dividend distribution.
📊 Overview
Verisk Analytics, Inc. operates within the analytics sector, currently offering a dividend yield of 1.17%. The company pays a dividend per share of 1.81 USD, with a reliable dividend-paying track record of 8 years, having no recent cuts or suspensions. This stability indicates a sustainable dividend policy and a potential for long-term income for investors.
| Metric | Value |
|---|---|
| Sector | Analytics |
| Dividend yield | 1.17% |
| Current dividend per share | 1.81 USD |
| Dividend history | 8 years |
| Last cut or suspension | None |
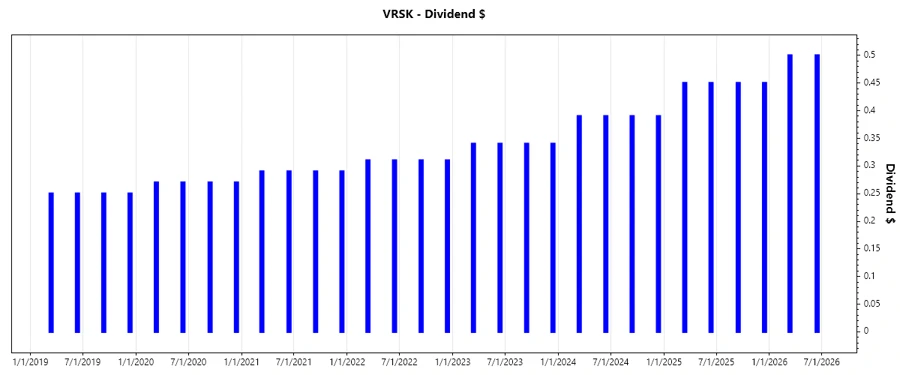
🗣️ Dividend History
Understanding the dividend history is crucial as it reflects the company's ability and willingness to distribute earnings consistently over time. Verisk has maintained a robust dividend payout history, demonstrating its stable financial standing and commitment to shareholder returns. This consistency enhances investor confidence in the company's financial management.
| Year | Dividend per Share (USD) |
|---|---|
| 2026 | 1.00 |
| 2025 | 1.80 |
| 2024 | 1.56 |
| 2023 | 1.36 |
| 2022 | 1.24 |
📈 Dividend Growth
Dividend growth over time reflects a company's capacity to increase shareholder value through higher payouts. For Verisk, the 3-year average growth rate stands at 13.23%, and the 5-year rate at 10.76%. Though moderate, this indicates a steady upward trajectory in returns to shareholders.
| Time | Growth |
|---|---|
| 3 years | 13.23% |
| 5 years | 10.76% |
The average dividend growth is 10.76% over 5 years. This shows moderate but steady dividend growth.
🧮 Payout Ratio
Analyzing the payout ratio is crucial to understanding the sustainability of dividends. The EPS-based payout ratio stands at 26.79%, and the FCF-based payout ratio at 20.99%. These low ratios suggest the company retains substantial earnings for reinvestment, indicating robust future dividend potential as well as financial health.
| Key figure | Ratio |
|---|---|
| EPS-based | 26.79% |
| Free cash flow-based | 20.99% |
With payout ratios of 26.79% (EPS) and 20.99% (FCF), Verisk demonstrates a disciplined approach, maintaining a secure cushion for future growth and shareholder distributions.
🔍 Cashflow & Capital Efficiency
Cash flow and capital efficiency metrics are pivotal in assessing a company's financial resilience. These metrics highlight the firm's ability to generate cash relative to its operational and capital expenses.
| Year | 2025 | 2024 | 2023 |
|---|---|---|---|
| Free Cash Flow Yield | 3.83% | 2.35% | 2.37% |
| Earnings Yield | 2.92% | 2.45% | 1.75% |
| CAPEX to Operating Cash Flow | 16.99% | 19.57% | 21.68% |
| Stock-based Compensation to Revenue | 1.76% | 1.66% | 2.01% |
| Free Cash Flow / Operating Cash Flow Ratio | 83.00% | 80.43% | 78.32% |
The firm's free cash flow and capital metrics imply effective cash management and a strong capacity to fund operations and future investments despite fluctuating yields over the years.
⚖️ Balance Sheet & Leverage Analysis
An evaluation of leverage and balance sheet health is fundamental in assessing financial stability. These ratios have implications on strategic flexibility and risk.
| Year | 2025 | 2024 | 2023 |
|---|---|---|---|
| Debt-to-Equity | 16.30 | 32.43 | 9.99 |
| Debt-to-Assets | 81.31% | 76.11% | 70.90% |
| Debt-to-Capital | 94.22% | 97.01% | 90.90% |
| Net Debt to EBITDA | 1.69 | 1.78 | 1.96 |
| Current Ratio | 1.20 | 0.74 | 1.05 |
| Quick Ratio | 1.20 | 0.74 | 1.05 |
| Financial Leverage | 20.05 | 42.60 | 14.08 |
Despite substantial leverage ratios, Verisk maintains operational liquidity with adequate current and quick ratios. High leverage ratios necessitate careful monitoring for a sustainable financial future.
💡 Fundamental Strength & Profitability
Profitability metrics are essential for examining operational efficacy and strategic prowess, impacting overall business viability and shareholder value.
| Year | 2025 | 2024 | 2023 |
|---|---|---|---|
| Return on Equity | 2.94% | 9.57% | 1.98% |
| Return on Assets | 14.66% | 22.45% | 14.07% |
| Margins: Net | 29.56% | 33.23% | 22.91% |
| Margins: EBIT | 44.91% | 46.96% | 42.62% |
| Margins: EBITDA | 54.95% | 57.57% | 53.11% |
| Margins: Gross | 67.31% | 68.73% | 67.31% |
| R&D to Revenue | 0% | 0% | 0% |
Although R&D investment appears lacking, profitability indicators reveal efficient cost management and solid return metrics signifying robust business health.
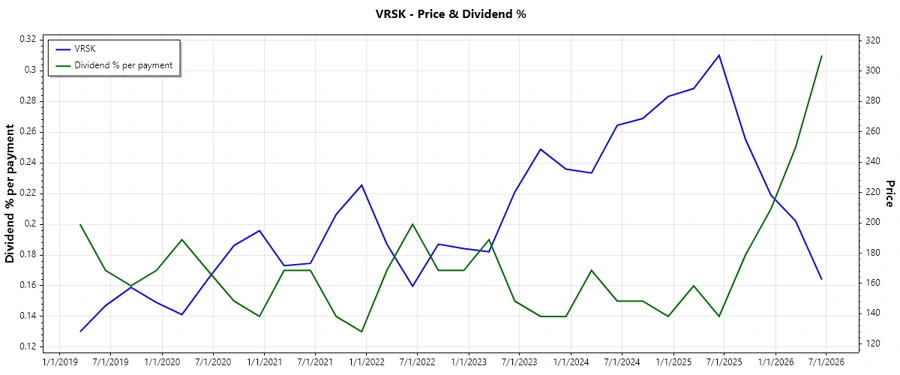
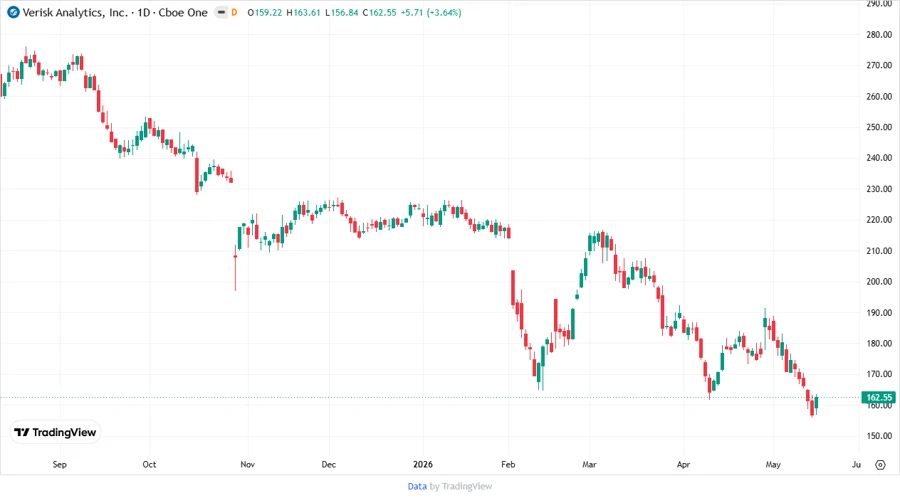
📉 Price Development
✅ Dividend Scoring System
| Category | Score | Score Bar |
|---|---|---|
| Dividend yield | 2 | |
| Dividend Stability | 4 | |
| Dividend growth | 3 | |
| Payout ratio | 4 | |
| Financial stability | 3 | |
| Dividend continuity | 5 | |
| Cashflow Coverage | 4 | |
| Balance Sheet Quality | 3 |
Total Score: 28/40
🗳️ Rating
In summary, Verisk Analytics, Inc. presents a balanced dividend profile with moderate yield and growth, coupled with stable payout and efficient financial management. While leverage metrics warrant attention, the company's robustness in dividend stability and continuity, coupled with solid capital efficiency, earn it a hold recommendation for cautious dividend investors.
Smart Data Insight
Master the Perfect Entry & Exit for this Stock
Don't leave your profits to chance. Historically, this stock follows specific seasonal patterns that institutional traders use to maximize returns.
- ✅ Identify the "Golden Buying Window"
- ✅ Avoid high-risk correction cycles
- ✅ Backtested data from the last 20+ years