October 14, 2025 a 07:46 am

VRSK: Dividend Analysis - Verisk Analytics, Inc.
Verisk Analytics, Inc. showcases a robust dividend profile characterized by consistent growth and stability. With a moderate dividend yield and a noteworthy dividend history spanning over seven years, the company represents a reliable option for dividend-focused investors. However, close monitoring of its financial metrics like payout ratios remains essential to ensure continued dividend health.
📊 Overview
Verisk Analytics, Inc. operates in a sector that offers stability, reflected in its consistent dividend yield and disciplined payout strategy. The company's adherence to its dividend history highlights its commitment to shareholder returns.
| Indicator | Value |
|---|---|
| Sector | Professional, Scientific, and Technical Services |
| Dividend yield | 0.6821% |
| Current dividend per share | $1.56 |
| Dividend history | 7 years |
| Last cut or suspension | None |
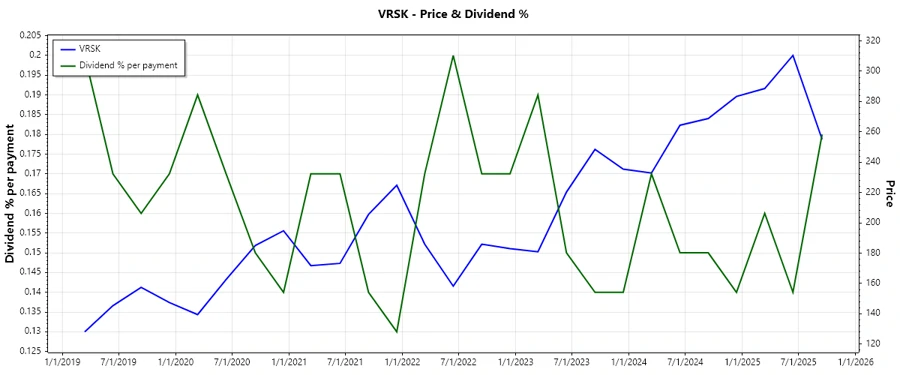
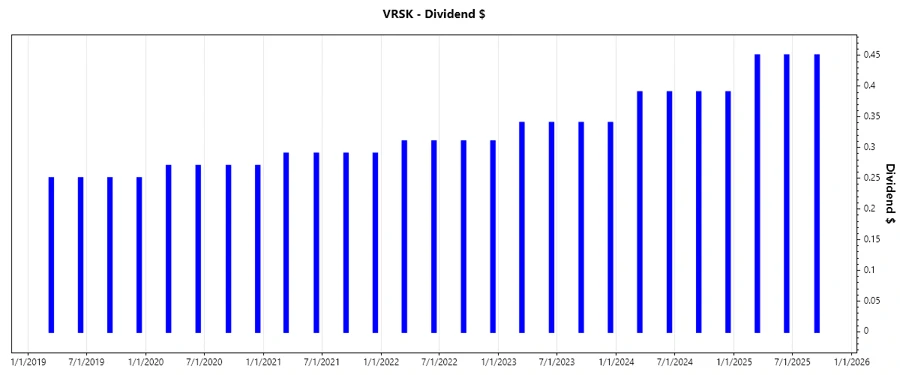
🗣️ Dividend History
The dividend history of Verisk Analytics underscores its commitment to providing consistent shareholder returns. This consistency is vital for long-term investors seeking stability and dependability from their investments.
| Year | Dividend Per Share (USD) |
|---|---|
| 2025 | 1.35 |
| 2024 | 1.56 |
| 2023 | 1.36 |
| 2022 | 1.24 |
| 2021 | 1.16 |
📈 Dividend Growth
Dividend growth serves as a crucial indicator of a company's future profitability and financial health. Over the past years, Verisk Analytics has demonstrated a stable upward trend in its dividend distributions, which reflects its sound financial practices.
| Time | Growth |
|---|---|
| 3 years | 10.38% |
| 5 years | 9.30% |
The average dividend growth is 9.30% over 5 years. This shows moderate but steady dividend growth.
✅ Payout Ratio
The payout ratio is an essential metric in assessing the sustainability of a company’s dividend payments. It indicates what portion of earnings or cash flow is returned to shareholders.
| Key figure | Ratio |
|---|---|
| EPS-based | 23.76% |
| Free cash flow-based | 21.32% |
The EPS payout ratio of 23.76% and the FCF payout ratio of 21.32% indicate that Verisk Analytics maintains a conservative approach, ensuring sufficient retained earnings for growth and stability.
📊 Cashflow & Capital Efficiency
Understanding cash flow and capital efficiency is critical for investors to assess how effectively a company manages its resources to sustain dividends and grow its business.
| Metric | 2024 | 2023 | 2022 |
|---|---|---|---|
| Free Cash Flow Yield | 2.35% | 2.37% | 2.82% |
| Earnings Yield | 2.45% | 1.75% | 3.43% |
| CAPEX to Operating Cash Flow | 19.57% | 21.68% | 25.94% |
| Stock-based Compensation to Revenue | 1.66% | 2.01% | 2.26% |
| Free Cash Flow / Operating Cash Flow Ratio | 80.43% | 78.32% | 74.06% |
These figures demonstrate a solid cash flow performance, crucial for sustaining dividend payouts while investing in growth opportunities.
📊 Balance Sheet & Leverage Analysis
Analyzing a company's balance sheet and leverage ratios provides insights into its financial stability and risk associated with debt.
| Metric | 2024 | 2023 | 2022 |
|---|---|---|---|
| Debt-to-Equity | 32.43 | 9.99 | 2.26 |
| Debt-to-Assets | 76.11% | 70.90% | 56.82% |
| Debt-to-Capital | 97.01% | 90.90% | 69.34% |
| Net Debt to EBITDA | 1.78 | 1.96 | 2.21 |
| Current Ratio | 0.74 | 1.05 | 0.40 |
| Quick Ratio | 0.74 | 1.05 | 0.40 |
| Financial Leverage | 42.60 | 14.08 | 3.98 |
While Verisk Analytics maintains a high debt ratio, its solid coverage ratios indicate a strong ability to meet its financial commitments.
📉 Fundamental Strength & Profitability
A thorough analysis of profitability and return metrics helps in understanding the long-term viability of a company's dividend distribution strategy.
| Metric | 2024 | 2023 | 2022 |
|---|---|---|---|
| Return on Equity | 9.57% | 1.98% | 0.55% |
| Return on Assets | 22.45% | 14.07% | 13.71% |
| Net Margin | 33.23% | 22.91% | 38.22% |
| EBIT Margin | 46.96% | 42.62% | 56.12% |
| EBITDA Margin | 57.57% | 53.11% | 69.73% |
| Gross Margin | 68.73% | 67.31% | 66.98% |
| Research & Development to Revenue | 0% | 0% | 0% |
Verisk Analytics shows strong profitability, which supports its dividend policy and positions the company for future growth.
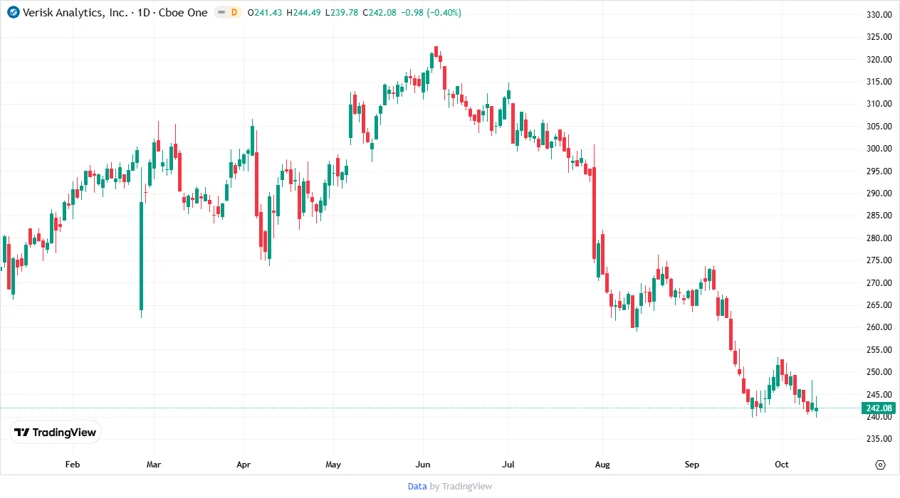
Price Development
✅ Dividend Scoring System
| Category | Score | Score Bar |
|---|---|---|
| Dividend yield | 2 | |
| Dividend Stability | 4 | |
| Dividend growth | 4 | |
| Payout ratio | 5 | |
| Financial stability | 3 | |
| Dividend continuity | 5 | |
| Cashflow Coverage | 4 | |
| Balance Sheet Quality | 3 |
Overall Score: 30/40
Rating
Verisk Analytics, Inc. has a rigorous dividend portfolio that underscores its potential as a robust dividend issuer. Despite its high market valuation, the conservative payout ratios and solid financial footing provide a sound basis for continued dividend reliability. We recommend investors consider this stock as a long-term holding in a diversified dividend portfolio.
Smart Data Insight
Master the Perfect Entry & Exit for this Stock
Don't leave your profits to chance. Historically, this stock follows specific seasonal patterns that institutional traders use to maximize returns.
- ✅ Identify the "Golden Buying Window"
- ✅ Avoid high-risk correction cycles
- ✅ Backtested data from the last 20+ years