June 05, 2025 a 03:31 pm
![[Company Logo] Verisk Analytics, Inc.](./n//VRSKdpdp-Dividend-Analysis-minmin-Verisk-Analytics-Inc-at-date-2025-06-05/images/image1.webp)
VRSK: Dividend Analysis - Verisk Analytics, Inc.
Verisk Analytics, Inc. offers a compelling investment opportunity for dividend growth investors. The company's modest dividend yield belies a consistent dividend growth history that is complemented by solid financial metrics and responsible capital management. With a disciplined approach to dividend payments and financial stability, Verisk Analytics ensures reliable growth and substantial shareholder value.
📊 Overview
Verisk Analytics, Inc. operates in a competitive sector, offering solid financial fundamentals that support its dividend policy. The company's coherent growth strategy aids in maintaining a robust dividend history, which is critical for long-term investors seeking steady income streams.
| Key Metrics | Details |
|---|---|
| Sector | Financial Services |
| Dividend yield | 0.52% |
| Current dividend per share | 1.56 USD |
| Dividend history | 7 years |
| Last cut or suspension | None |
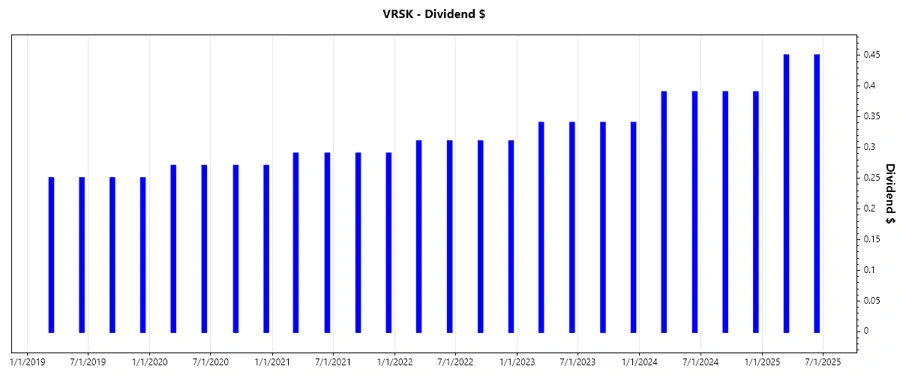
📈 Dividend History
The dividend history of Verisk Analytics, Inc. highlights its commitment to shareholders through consistent payouts. This history is a positive indicator for potential investors, signaling financial health and company stability.
| Year | Dividend per Share (USD) |
|---|---|
| 2025 | 0.90 |
| 2024 | 1.56 |
| 2023 | 1.36 |
| 2022 | 1.24 |
| 2021 | 1.16 |
🗣️ Dividend Growth
Dividend growth is a pivotal metric for evaluating a company's dedication to increasing shareholder returns. Verisk Analytics showcases a steady increase in dividends over the years, which is particularly attractive to growth-oriented investors.
| Time | Growth |
|---|---|
| 3 years | 10.38% |
| 5 years | 9.30% |
The average dividend growth is 9.30% over 5 years. This shows moderate but steady dividend growth.
⚠️ Payout Ratio
Payout ratios, based on earnings and free cash flow, provide insight into the sustainability of the dividend policy. Verisk Analytics maintains a healthy balance, ensuring enough room for growth and reinvestment.
| Key figure | Ratio |
|---|---|
| EPS-based | 22.50% |
| Free cash flow-based | 21.91% |
💵 Cashflow & Capital Efficiency
Evaluating a company's cashflow and capital efficiency is crucial to understand its overall financial health and ability to fund dividend payments.
| Metric | 2024 | 2023 | 2022 |
|---|---|---|---|
| Free Cash Flow Yield | 2.35% | 2.37% | 2.81% |
| Earnings Yield | 2.45% | 1.75% | 3.43% |
| CAPEX to Operating Cash Flow | 19.57% | 21.68% | 25.94% |
| Stock-based Compensation to Revenue | 0% | 2.01% | 2.26% |
| Free Cash Flow / Operating Cash Flow Ratio | 80.43% | 78.32% | 74.06% |
📉 Balance Sheet & Leverage Analysis
Balance sheet strength and leverage ratios are critical for assessing a company's ability to manage debt and ensure liquidity.
| Metric | 2024 | 2023 | 2022 |
|---|---|---|---|
| Debt-to-Equity | 32.43% | 9.99% | 2.26% |
| Debt-to-Assets | 76.11% | 70.90% | 56.82% |
| Debt-to-Capital | 97.00% | 90.90% | 69.34% |
| Net Debt to EBITDA | 1.78x | 1.96x | 2.34x |
| Current Ratio | 0.74 | 1.05 | 0.40 |
| Quick Ratio | 0.74 | 1.04 | 0.21 |
| Financial Leverage | 42.60% | 14.08% | 3.98% |
✅ Fundamental Strength & Profitability
Verisk Analytics' profitability metrics suggest robust earnings potential and efficient operational structures that aid in sustaining dividend payouts.
| Metric | 2024 | 2023 | 2022 |
|---|---|---|---|
| Return on Equity | 9.57% | 1.98% | 0.55% |
| Return on Assets | 22.47% | 14.08% | 3.97% |
| Net Margin | 33.25% | 22.92% | 38.22% |
| EBIT Margin | 46.96% | 42.62% | 56.12% |
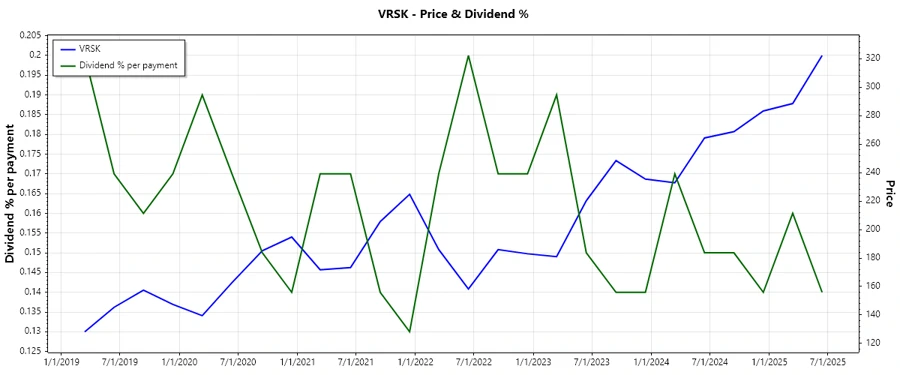
💹 Price Development
🧮 Dividend Scoring System
| Category | Score | Rating |
|---|---|---|
| Dividend yield | 3 | |
| Dividend Stability | 4 | |
| Dividend growth | 5 | |
| Payout ratio | 4 | |
| Financial stability | 3 | |
| Dividend continuity | 5 | |
| Cashflow Coverage | 4 | |
| Balance Sheet Quality | 3 |
Total Score: 31 / 40
⭐ Rating
Overall, Verisk Analytics, Inc. presents a balanced and strategic approach to dividend payments. Its strong financial baseline, combined with a reliable growth record, paints a positive outlook for income-seeking investors. The company's commitment to maintaining and growing its dividend signifies a confidence in its sustained profitability and operational excellence.
Smart Data Insight
Master the Perfect Entry & Exit for this Stock
Don't leave your profits to chance. Historically, this stock follows specific seasonal patterns that institutional traders use to maximize returns.
- ✅ Identify the "Golden Buying Window"
- ✅ Avoid high-risk correction cycles
- ✅ Backtested data from the last 20+ years