January 24, 2026 a 08:15 am

VMC: Trend and Support & Resistance Analysis - Vulcan Materials Company
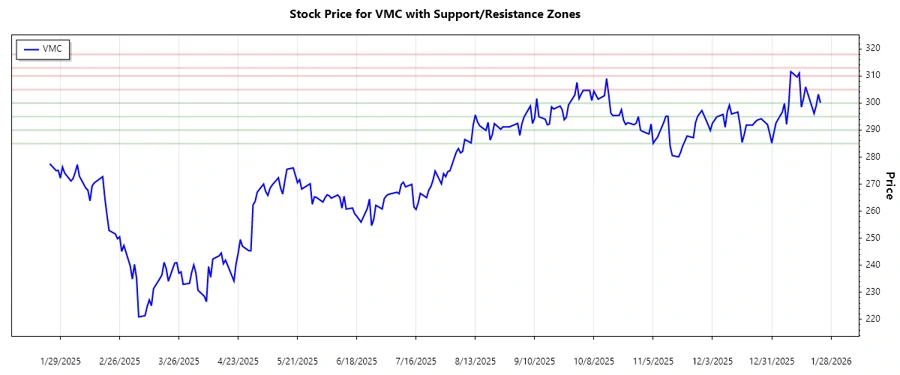
Vulcan Materials Company, a leading producer of construction aggregates, has shown significant price movement over recent months. The technical indicators suggest a bullish trend, with the stock frequently rebounding from key support levels. This performance is reflective of stable demand in the construction sector, positioning VMC as a potentially attractive investment, albeit with market volatility considerations.
Trend Analysis
Based on the past months' data, VMC has shown mixed movements with recent weeks highlighting a potential shift. Calculating the EMA20 and EMA50 from available closing prices yields insights into the prevailing market sentiment:
| Date | Closing Price | Trend |
|---|---|---|
| 2026-01-23 | 300.07 | ⚖️ |
| 2026-01-22 | 303.27 | ⚖️ |
| 2026-01-21 | 299.01 | ⚖️ |
| 2026-01-20 | 296.15 | ⚖️ |
| 2026-01-16 | 305.97 | ▲ |
| 2026-01-15 | 301.66 | ▲ |
| 2026-01-14 | 298.48 | ▲ |
The calculated EMAs show a fluctuating yet consistent testing of resistance and support lines, pointing towards potential bullish signals.
Support and Resistance
The analysis of closing prices has identified the following support and resistance zones:
| Zone Type | From | To | |
|---|---|---|---|
| Support | 285 | 290 | ▼ |
| Support | 295 | 300 | ▼ |
| Resistance | 305 | 310 | ▲ |
| Resistance | 313 | 318 | ▲ |
The current price level is slightly above the lower resistance zone, indicating a bullish attempt to break upwards.
Conclusion
The market analysis for Vulcan Materials Company suggests potential for upward movement as the stock gestures towards higher resistance levels. With a stable market presence and increased construction demand, VMC could capitalize on industry growth, though market conditions and external factors remain critical. A close monitoring of support/resistance zones and EMA indicators is advised for informed trading decisions.