November 14, 2025 a 11:44 am
VMC: Fibonacci Analysis - Vulcan Materials Company
The Vulcan Materials Company's stock has shown significant resilience with its recent performance. Given its operation across critical construction sectors, the stock often mirrors the larger economic trend. The historical data points to a dominant downtrend after reaching a notable high, although there are signs of potential stabilization. The latest movements suggest this could be a point of interest for potential investors analyzing retracement opportunities. With its diversified business model, Vulcan Materials remains a sturdy candidate in its sector.
Fibonacci Analysis
| Detail | Information |
|---|---|
| Start Date | 2024-12-06 |
| End Date | 2025-11-13 |
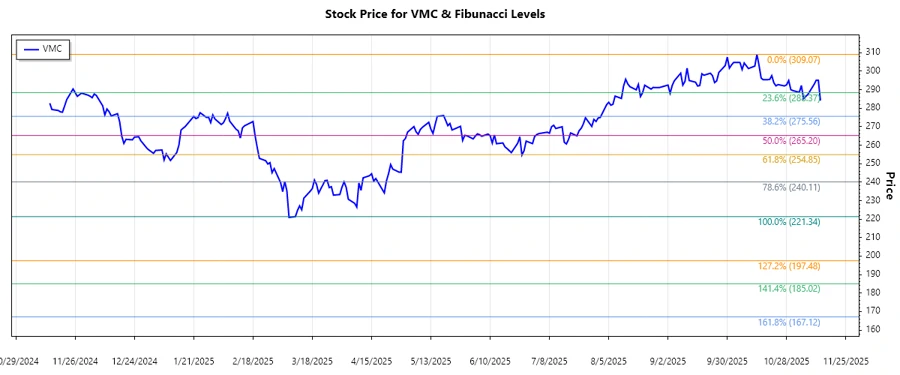
| High Point | $309.07 on 2025-10-14 |
| Low Point | $221.34 on 2025-03-10 |
| Fibonacci 0.236 | $245.47 |
| Fibonacci 0.382 | $257.62 |
| Fibonacci 0.5 | $265.21 |
| Fibonacci 0.618 | $272.80 |
| Fibonacci 0.786 | $284.95 |
| Current Price Position | Fib 0.786 Retracement Level |
| Interpretation | The current price is within the 0.786 retracement level, suggesting potential resistance but also an opportunity for rebound if the level holds. |
Conclusion
The Vulcan Materials Company, exhibiting a dominant downtrend over recent months, is presenting interesting technical opportunities. The stock currently hovers around the 0.786 Fibonacci retracement level, which could signify either a pivotal resistance point or a launching pad for recovery if economic conditions improve. Analysts should consider the company's strong market position in construction materials as a factor potentially mitigating deeper declines. Nevertheless, market volatility remains a concern, warranting cautious monitoring. With market dynamics in flux, VMC's stock might appeal to both opportunistic traders and long-term holders who have confidence in its fundamental strengths.
Smart Data Insight
Master the Perfect Entry & Exit for this Stock
Don't leave your profits to chance. Historically, this stock follows specific seasonal patterns that institutional traders use to maximize returns.
- ✅ Identify the "Golden Buying Window"
- ✅ Avoid high-risk correction cycles
- ✅ Backtested data from the last 20+ years