
July 14, 2026 a 07:46 am


VMC: Dividend Analysis - Vulcan Materials Company
Vulcan Materials Company (VMC) exhibits a strong dividend profile with a consistent history spanning over four decades. Despite a modest dividend yield, the company displays remarkable resilience and growth in its dividend payments. The stable payout ratios and robust earnings further underline the firm's dividend reliability, making it a solid consideration for income investors.
📊 Overview
Vulcan Materials Company operates primarily in the Materials sector. The company has managed to sustain a dividend yield of 0.70%, with the current dividend per share at $1.97. This reflects a commitment to shareholder returns, backed by an impressive 42-year history of uninterrupted payouts. Notably, there have been no recent cuts or suspensions, reinforcing confidence in the company's dividend philosophy.
| Metric | Value |
|---|---|
| Sector | Materials |
| Dividend yield | 0.70% |
| Current dividend per share | $1.97 USD |
| Dividend history | 42 years |
| Last cut or suspension | None |
🗣️ Dividend History
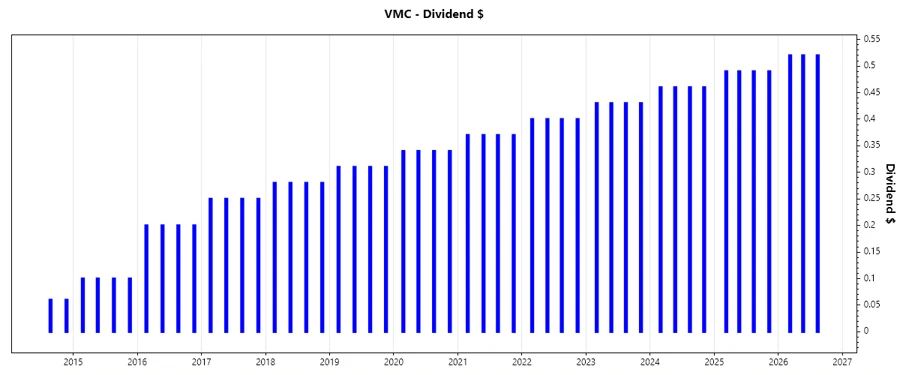
The long-standing history of dividend payments is a testament to VMC's dedication towards rewarding its shareholders. Such an extensive track record is indicative of financial stability and operational robustness, vital for investors relying on consistent income. The company's ability to maintain and increase dividends over the years enhances its appeal to conservative income-seeking investors.
| Year | Dividend per share |
|---|---|
| 2026 | $1.56 |
| 2025 | $1.96 |
| 2024 | $1.84 |
| 2023 | $1.72 |
| 2022 | $1.60 |
📈 Dividend Growth
Dividend growth metrics are crucial indicators of a company's potential to increase shareholder value over time. VMC's average growth rates over the 3 and 5-year periods attest to its moderate but stable upward trajectory in dividend payments, reflecting well on earnings growth and operational leverage.
| Time | Growth |
|---|---|
| 3 years | 6.99% |
| 5 years | 7.58% |
The average dividend growth is 7.58% over 5 years. This shows moderate but steady dividend growth, an encouraging sign for long-term dividend sustainability and attractiveness.
📉 Payout Ratio
Payout ratios provide insight into the sustainability of dividend payments relative to earnings and cash flows. VMC showcases prudent financial management with an EPS-based payout ratio of 23.25% and a FCF-based ratio of 22.89%. Such figures indicate sufficient buffer room for future growth in dividends, maintaining investor confidence.
| Key Figure | Ratio |
|---|---|
| EPS-based | 23.25% |
| Free cash flow-based | 22.89% |
This payout discipline suggests that VMC can maintain its dividend commitments without jeopardizing its financial health, vital for long-term investment security.
✅ Cashflow & Capital Efficiency
For any business, the ability to generate free cash flow and use capital efficiently is paramount. VMC's metrics indicate robust cash flow generation and prudent capital application, essential for covering dividend payments and supporting operational efficiency.
| Year | 2025 | 2024 | 2023 |
|---|---|---|---|
| Free Cash Flow Yield | 3.02% | 2.37% | 2.20% |
| Earnings Yield | 2.87% | 2.67% | 3.09% |
| CAPEX to Operating Cash Flow | 37.38% | 42.81% | 56.78% |
| Stock-based Compensation to Revenue | 0.80% | 0.72% | 0.81% |
| Free Cash Flow / Operating Cash Flow Ratio | 62.62% | 57.19% | 43.22% |
| Return on Invested Capital | 8.02% | 6.59% | 7.89% |
These results highlight VMC's ability to effectively cover its dividend obligations while investing in business expansion, thus ensuring long-term operational growth and shareholder satisfaction.
🔍 Balance Sheet & Leverage Analysis
Assessment of the company's leverage is crucial to understanding its financial soundness. VMC's debt and liquidity ratios suggest prudent borrowing practices, low-risk exposure, and a robust framework to manage financial obligations, ensuring the long-term viability of its dividend policy.
| Year | 2025 | 2024 | 2023 |
|---|---|---|---|
| Debt-to-Equity | 63.43% | 71.80% | 58.60% |
| Debt-to-Assets | 32.38% | 34.08% | 30.15% |
| Debt-to-Capital | 38.81% | 41.79% | 36.95% |
| Net Debt to EBITDA | 2.03x | 2.66x | 1.69x |
| Current Ratio | 2.59 | 1.83 | 3.17 |
| Quick Ratio | 1.97 | 1.28 | 2.39 |
| Financial Leverage | 1.96 | 2.11 | 1.94 |
This balanced leverage profile allows VMC to maintain financial flexibility and resilience, insulating it from market volatility and ensuring robust financial underpinning for its dividend commitments.
💪 Fundamental Strength & Profitability
Understanding fundamental strength and profitability insights is necessary to ascertain an entity's capacity to generate earnings and sustain dividends. VMC displays solid profitability metrics, with stable margins across the board, highlighting its operating efficiency and competitive position within its industry.
| Year | 2025 | 2024 | 2023 |
|---|---|---|---|
| Return on Equity | 12.68% | 11.23% | 12.47% |
| Return on Assets | 6.47% | 5.33% | 6.42% |
| Net Margin | 13.63% | 12.29% | 11.99% |
| EBIT Margin | 23.07% | 18.38% | 18.52% |
| EBITDA Margin | 32.37% | 26.70% | 26.27% |
| Gross Margin | 27.30% | 26.96% | 25.04% |
| Research & Development to Revenue | 0% | 0% | 0% |
These metrics underscore VMC's efficient management and revenue generation capabilities, providing a stable platform for continued dividend success and investor returns.
📊 Price Development
🧮 Dividend Scoring System
| Criteria | Score (1-5) | Score Bar |
|---|---|---|
| Dividend Yield | 2 | |
| Dividend Stability | 5 | |
| Dividend Growth | 4 | |
| Payout Ratio | 5 | |
| Financial Stability | 4 | |
| Dividend Continuity | 5 | |
| Cashflow Coverage | 4 | |
| Balance Sheet Quality | 4 |
Total Score: 33/40
🌟 Rating
Vulcan Materials Company demonstrates a consistent and robust dividend policy supported by solid financial metrics and operational excellence. The company's strategic focus on dividend continuity, balanced growth, and financial stability translates into a commendable dividend score. VMC is an attractive long-term investment for dividend-focused investors seeking stability and moderate growth in payouts.
Smart Data Insight
Master the Perfect Entry & Exit for this Stock
Don't leave your profits to chance. Historically, this stock follows specific seasonal patterns that institutional traders use to maximize returns.
- ✅ Identify the "Golden Buying Window"
- ✅ Avoid high-risk correction cycles
- ✅ Backtested data from the last 20+ years