February 02, 2026 a 03:31 pm
 📊
📊
🗣️
📈
 📉
📉
 ✅
✅
VMC: Dividend Analysis - Vulcan Materials Company
Vulcan Materials Company has consistently demonstrated a commitment to returning value to its shareholders through stable dividend payments. The company's long-standing history of dividends highlights its reliable cash flow and commitment to shareholder returns. Despite market fluctuations, Vulcan Materials has shown resilience and strategic growth, making it an attractive option for dividend-seeking investors.
Overview
The current dividend profile of Vulcan Materials is characterized by a modest but consistent yield. Analysis of dividend-related metrics reflects the company's disciplined financial management and commitment to maintaining a competitive dividend.
| Item | Details |
|---|---|
| Sector | Basic Materials |
| Dividend yield | 0.67 % |
| Current dividend per share | 1.85 USD |
| Dividend history | 41 years |
| Last cut or suspension | 2012 |
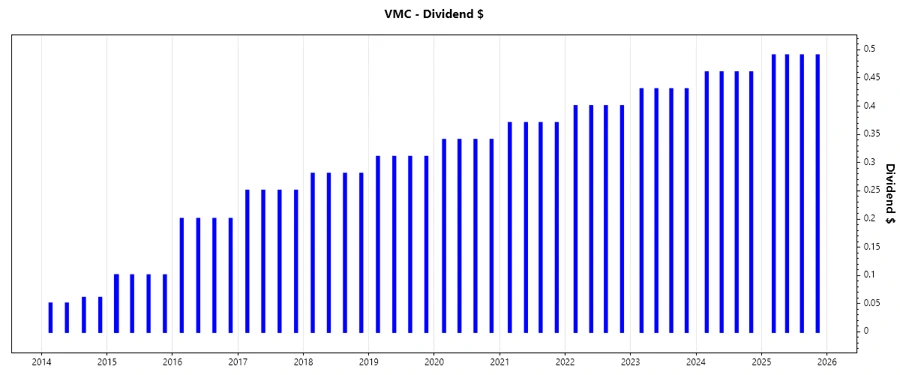
Dividend History
The history of dividends is a testament to a company's financial stability and policy towards shareholder returns. Vulcan Materials' history demonstrates its resiliency against economic downturns and highlights a strategic focus on dividends as a core part of shareholder strategy.
| Year | Dividend Per Share (USD) |
|---|---|
| 2025 | 1.96 |
| 2024 | 1.84 |
| 2023 | 1.72 |
| 2022 | 1.6 |
| 2021 | 1.48 |
Dividend Growth
Analyzing the growth in dividends provides insight into a company's future potential to increase shareholder returns. Vulcan Materials shows steady growth in dividends, reflecting effective management and sustainable earnings capability.
| Time | Growth |
|---|---|
| 3 years | 7.00 % |
| 5 years | 7.58 % |
The average dividend growth is 7.58 % over 5 years. This shows moderate but steady dividend growth.
📉
Payout Ratio
The payout ratio is crucial in determining how well earnings support dividend payments. Vulcan Materials maintains healthy payout ratios, suggesting a sustainable dividend policy.
| Key figure | Ratio |
|---|---|
| EPS-based | 21.75 % |
| Free cash flow-based | 23.14 % |
With an EPS payout ratio of 21.75% and a FCF payout ratio of 23.14%, Vulcan Materials demonstrates a strategic approach by maintaining low payout ratios, promoting financial flexibility and continuous dividends.
✅Cashflow & Capital Efficiency
A strong cash flow and efficient capital allocation testify to a company's financial health and its ability to meet dividend commitments.
| Metric | 2022 | 2023 | 2024 |
|---|---|---|---|
| Free Cash Flow Yield | 2.30 % | 2.20 % | 2.37 % |
| Earnings Yield | 2.47 % | 3.09 % | 2.68 % |
| CAPEX to Operating Cash Flow | 53.35 % | 56.78 % | 42.81 % |
| Stock-based Compensation to Revenue | 0.56 % | 0.81 % | 0.72 % |
| Free Cash Flow / Operating Cash Flow Ratio | 46.65 % | 43.22 % | 57.19 % |
Vulcan's solid free cash flow yield and efficient capital allocation underscore its ability to sustain dividend payments and invest for growth.
⚠️Balance Sheet & Leverage Analysis
A strong balance sheet and prudent leverage improve a company's resilience against economic challenges and increase its ability to persistently pay dividends.
| Metric | 2022 | 2023 | 2024 |
|---|---|---|---|
| Debt-to-Equity | 65.30 % | 58.60 % | 71.80 % |
| Debt-to-Assets | 31.78 % | 30.15 % | 34.08 % |
| Debt-to-Capital | 39.50 % | 36.95 % | 41.79 % |
| Net Debt to EBITDA | 2.85 | 1.69 | 2.66 |
| Current Ratio | 1.99 | 3.17 | 1.83 |
| Quick Ratio | 1.38 | 2.39 | 1.28 |
| Financial Leverage | 2.05 | 1.94 | 2.11 |
Vulcan’s leverage ratios are effectively managed, maintaining financial stability and flexibility to support ongoing dividend payments.
📈Fundamental Strength & Profitability
Fundamental strength and profitability determine a company's capability to generate earnings and sustain dividends.
| Metric | 2022 | 2023 | 2024 |
|---|---|---|---|
| Return on Equity | 8.31 % | 12.47 % | 11.23 % |
| Return on Assets | 4.04 % | 6.42 % | 5.33 % |
| Margins: Net | 7.87 % | 11.99 % | 12.29 % |
| Margins: EBIT | 13.08 % | 18.52 % | 18.38 % |
| Margins: EBITDA | 20.92 % | 26.27 % | 26.70 % |
| Research & Development to Revenue | 0 % | 0 % | 0 % |
Consistent fundamental strength indicates robust profitability and ability to maintain dividends even in demanding market contexts.
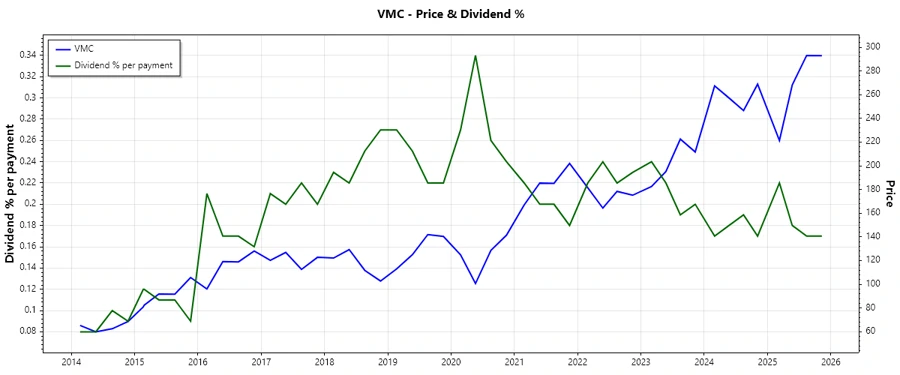
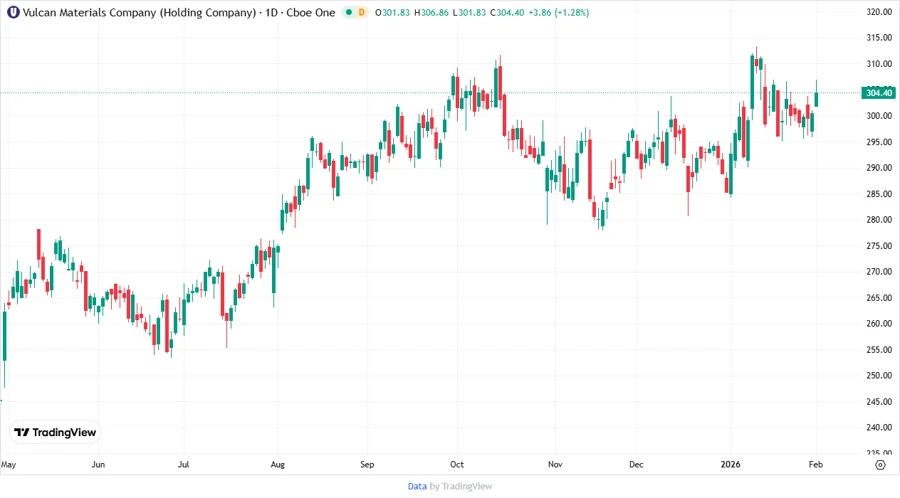
📉Price Development
✅
Dividend Scoring System
| Category | Score | Bar |
|---|---|---|
| Dividend yield | 3 | |
| Dividend Stability | 5 | |
| Dividend growth | 4 | |
| Payout ratio | 4 | |
| Financial stability | 4 | |
| Dividend continuity | 5 | |
| Cashflow Coverage | 4 | |
| Balance Sheet Quality | 4 |
Total Score: 33 out of 40
Rating
Vulcan Materials Company provides a compelling case for dividend investors, with its robust dividends, disciplined payout ratios, and steady growth. The company's comprehensive commitment to balancing shareholder returns with maintaining financial strength and flexibility makes it a recommended buy for long-term dividend income seekers.