October 06, 2025 a 02:47 am

VMC: Dividend Analysis - Vulcan Materials Company
Vulcan Materials Company stands as a prominent figure in the construction materials sector, boasting a rich legacy of stable dividend payouts. With a market capitalization exceeding $40 billion and a robust dividend history, the company offers a reliable income stream to its investors. However, with a relatively modest dividend yield, the focus remains on its growth, stability, and overall financial health. Let us delve into a detailed analysis to understand its dividends better.
📊 Overview
Vulcan Materials Company exhibits a steady dividend payout that reflects its commitment to shareholder value in the long-term. Its position in the sector also indicates its focus on capital-intensive projects and runs a tight ship in managing its payouts.
| Feature | Detail |
|---|---|
| Sector | Construction Materials |
| Dividend yield | 0.66% |
| Current dividend per share | 1.85 USD |
| Dividend history | 41 years |
| Last cut or suspension | None |
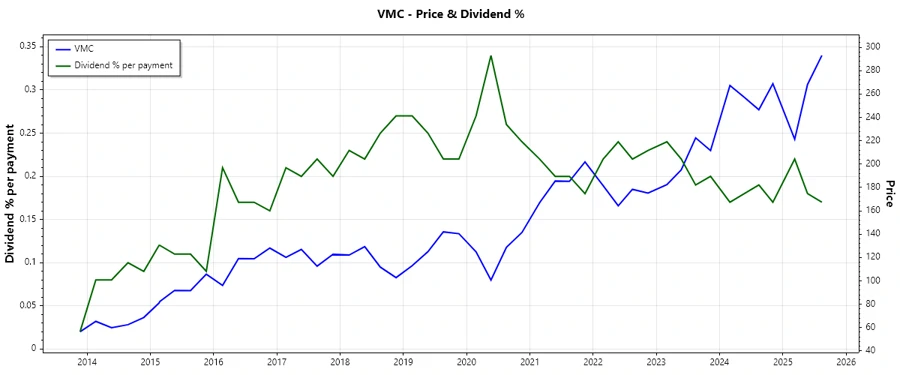
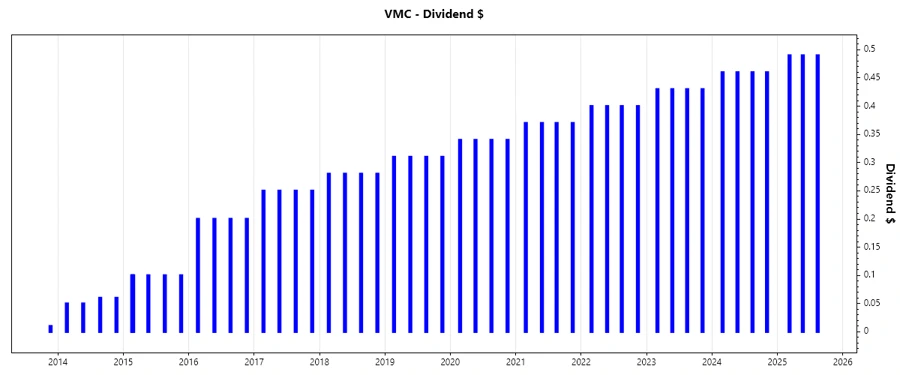
📈 Dividend History
The dividend history underscores Vulcan's commitment to consistent returns. This stable payout policy demonstrates strong management and predictable cash flows, crucial for income-seeking investors.
| Year | Dividend per Share (USD) |
|---|---|
| 2025 | 1.47 |
| 2024 | 1.84 |
| 2023 | 1.72 |
| 2022 | 1.60 |
| 2021 | 1.48 |
📈 Dividend Growth
Dividend growth is a critical measure of the ability of a company to increase shareholder value. Despite a modest yield, growth rates indicate potential for increasing future payouts.
| Time | Growth |
|---|---|
| 3 years | 7.53% |
| 5 years | 8.21% |
The average dividend growth is 8.21% over 5 years. This shows moderate but steady dividend growth, which provides a cushion for future payouts.
✅ Payout Ratio
Payout ratios offer insight into dividend sustainability. A balance between earnings and free cash flow payout ratios is crucial for any company maintaining or increasing its dividends.
| Key figure | Ratio |
|---|---|
| EPS-based | 25.70% |
| Free cash flow-based | 22.23% |
The payout ratios display a cautious approach with 25.70% (EPS) and 22.23% (FCF), indicating retained earnings for reinvestments while maintaining rewarding investors.
📉 Cashflow & Capital Efficiency
Understanding cash flow dynamics and capital efficiency helps in assessing a company's operational attractiveness and financial soundness.
| Measure | 2024 | 2023 | 2022 |
|---|---|---|---|
| Free Cash Flow Yield | 2.37% | 2.20% | 2.30% |
| Earnings Yield | 2.68% | 3.09% | 2.47% |
| CAPEX to Operating Cash Flow | 42.81% | 56.78% | 53.35% |
| Stock-based Compensation to Revenue | 0.72% | 0.81% | 0.56% |
| Free Cash Flow / Operating Cash Flow Ratio | 57.19% | 43.22% | 46.65% |
The cash flow metrics suggest stability, favoring operational strength with good CAPEX management. Thereby upholding financial health while promoting strategic investments.
⚠️ Balance Sheet & Leverage Analysis
Balance sheet analysis offers a view of financial stability, key in turbulent periods. Evaluating leverage ratios is critical for evaluating debt sustainability.
| Measure | 2024 | 2023 | 2022 |
|---|---|---|---|
| Debt-to-Equity | 71.80% | 58.60% | 65.30% |
| Debt-to-Assets | 34.08% | 30.15% | 31.78% |
| Debt-to-Capital | 41.79% | 36.95% | 39.50% |
| Net Debt to EBITDA | 2.66 | 1.69 | 2.85 |
| Current Ratio | 1.83 | 3.17 | 1.99 |
| Quick Ratio | 1.28 | 2.39 | 1.38 |
| Financial Leverage | 2.11 | 1.94 | 2.05 |
Financial leverage remains controlled, showcasing efforts in sustaining leverage ratios, which balances risk management with growth potential.
📊 Fundamental Strength & Profitability
Analyzing fundamentals such as profitability ratios provides a nuanced understanding of business viability and shareholder returns.
| Measure | 2024 | 2023 | 2022 |
|---|---|---|---|
| Return on Equity | 11.23% | 12.47% | 8.31% |
| Return on Assets | 5.33% | 6.42% | 4.04% |
| Margins: Net | 12.29% | 11.99% | 7.87% |
| EBIT Margin | 18.38% | 18.52% | 13.09% |
| EBITDA Margin | 26.70% | 26.27% | 20.92% |
| Gross Margin | 26.96% | 25.04% | 21.29% |
| Research & Development to Revenue | 0.00% | 0.00% | 0.00% |
Consistent returns on equity and assets signal robust underlying fundamentals and effective asset use, indicating profitable growth.
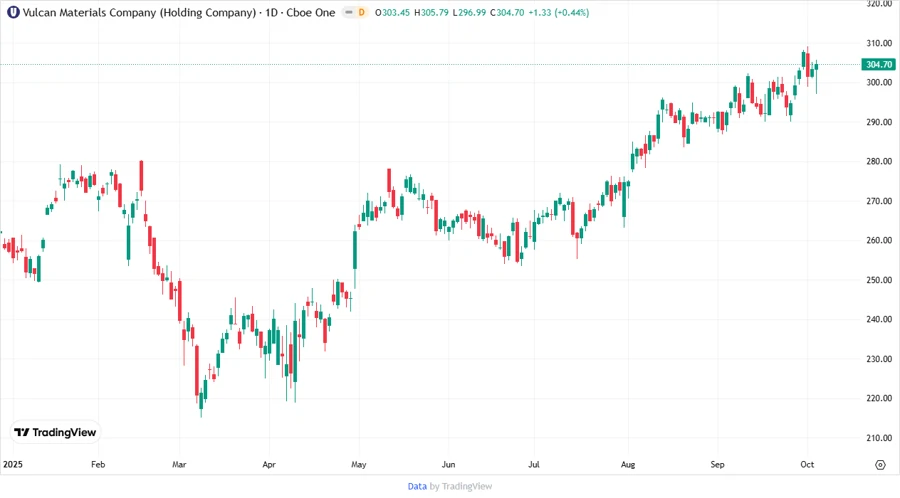
📈 Price Development
🗣️ Dividend Scoring System
| Category | Score (1-5) | Score Bar |
|---|---|---|
| Dividend yield | 2 | |
| Dividend Stability | 5 | |
| Dividend Growth | 4 | |
| Payout Ratio | 5 | |
| Financial Stability | 4 | |
| Dividend Continuity | 5 | |
| Cashflow Coverage | 3 | |
| Balance Sheet Quality | 4 |
Overall Total: 32/40
🗣️ Rating
Vulcan Materials Company exhibits a strong dividend profile with excellent stability and growth, backed by sound financial metrics. While the yield is modest, the potential for growth and secure payouts make it an attractive candidate for long-term dividend portfolios. The overall assessment suggests a prudent 'Hold' recommendation for income-focused investors, keeping an eye on future yield improvement opportunities.
Smart Data Insight
Master the Perfect Entry & Exit for this Stock
Don't leave your profits to chance. Historically, this stock follows specific seasonal patterns that institutional traders use to maximize returns.
- ✅ Identify the "Golden Buying Window"
- ✅ Avoid high-risk correction cycles
- ✅ Backtested data from the last 20+ years