August 20, 2025 a 12:47 pm

VMC: Dividend Analysis - Vulcan Materials Company
Vulcan Materials Company (VMC) presents a compelling case for dividend-focused investors with its steady dividend track record and disciplined financial management. Despite a modest yield of 0.66%, its 41 years of dividend payment history illustrate the company's commitment to returning value to shareholders. While the payout ratios are responsible, the company uses only a small portion of its earnings and cash flow for dividends, indicating room for future increases.
📊 Overview
Vulcan Materials Company operates in the essential materials sector, demonstrated by its modest dividend yield but impressive history of uninterrupted dividend payments. This suggests a robust and mature business model capable of sustaining shareholder returns amidst varying market conditions.
| Metric | Value |
|---|---|
| Sector | Essential Materials |
| Dividend Yield | 0.66 % |
| Current Dividend per Share | 1.85 USD |
| Dividend History | 41 years |
| Last Cut or Suspension | None |
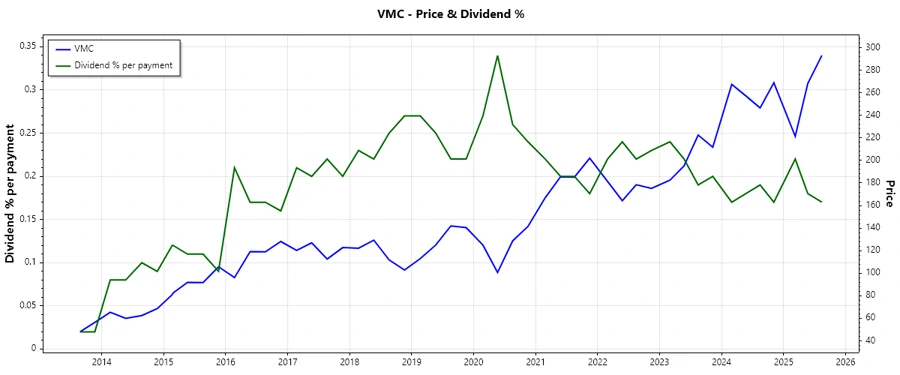
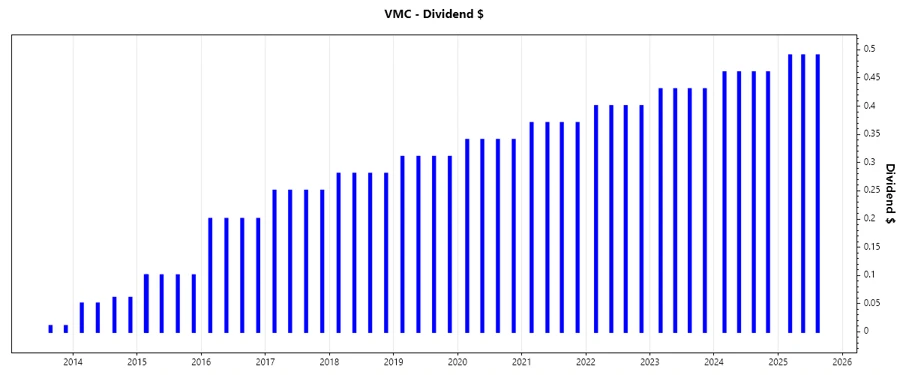
🗣️ Dividend History
The company's history of reliable dividend payments over four decades emphasizes its stability and commitment to shareholders. This consistency is crucial during market turbulence, offering investors a predictable income stream.
| Year | Dividend Per Share (USD) |
|---|---|
| 2025 | 1.47 |
| 2024 | 1.84 |
| 2023 | 1.72 |
| 2022 | 1.60 |
| 2021 | 1.48 |
📈 Dividend Growth
Understanding dividend growth is essential for evaluating long-term income potential and inflation hedging. Vulcan's dividends have been slowly yet steadily growing, indicating a strategy of sustainable increases rather than aggressive growth.
| Time | Growth |
|---|---|
| 3 years | 7.53 % |
| 5 years | 8.21 % |
The average dividend growth is 8.21 % over 5 years. This shows moderate but steady dividend growth, aligning with the company's cautious capital allocation strategy.
⚖️ Payout Ratio
The payout ratio provides insights into how much of the company's earnings and cash flow are paid out as dividends. Lower ratios indicate the capacity to sustain and potentially increase dividends.
| Key Figure | Ratio |
|---|---|
| EPS-based | 25.70 % |
| Free cash flow-based | 22.23 % |
The payout ratios are comfortably below the 50% threshold, suggesting the company's dividends are well-covered by both its earnings and free cash flow.
📈 Cashflow & Capital Efficiency
In assessing Vulcan's cash flow and capital efficiency, metrics such as earnings yield, CAPEX, and stock-based compensation illuminate its operational prowess. These indicators of cash flow stability and investment efficiency are pivotal for long-term financial health.
| Metric | 2024 | 2023 | 2022 |
|---|---|---|---|
| Free Cash Flow Yield | 2.37 % | 2.20 % | 2.30 % |
| Earnings Yield | 2.68 % | 3.09 % | 2.47 % |
| CAPEX to Operating Cash Flow | 42.81 % | 56.78 % | 53.35 % |
| Stock-based Compensation to Revenue | 0.72 % | 0.81 % | 0.56 % |
| Free Cash Flow / Operating Cash Flow Ratio | 57.19 % | 43.22 % | 46.65 % |
The free cash flow yield and earnings yield affirm Vulcan's cash-generating efficiency. A higher CAPEX ratio hints at substantial reinvestment into business growth, potentially augmenting longer-term returns.
🔍 Balance Sheet & Leverage Analysis
Vulcan's balance sheet illustrates prudent financial management through its leverage metrics. Ratios like Debt-to-Equity and Current Ratio provide critical insights into its financial stability and liquidity.
| Metric | 2024 | 2023 | 2022 |
|---|---|---|---|
| Debt-to-Equity | 0.72 | 0.59 | 0.65 |
| Debt-to-Assets | 0.34 | 0.30 | 0.32 |
| Debt-to-Capital | 0.42 | 0.37 | 0.40 |
| Net Debt to EBITDA | 2.66 | 1.68 | 2.85 |
| Current Ratio | 1.67 | 3.17 | 1.99 |
| Quick Ratio | 1.28 | 2.39 | 1.38 |
| Financial Leverage | 2.11 | 1.94 | 2.05 |
The relatively balanced Debt-to-Equity and healthy quick ratios suggest robust liquidity management and controlled debt levels, facilitating resilience to economic fluctuations.
📉 Fundamental Strength & Profitability
Analyzing Vulcan's fundamental strengths, its profitability metrics such as Return on Equity (ROE), Return on Assets (ROA), and operating margins are essential indicators of its operational success and strategic efficiency.
| Metric | 2024 | 2023 | 2022 |
|---|---|---|---|
| Return on Equity | 11.23 % | 12.47 % | 8.31 % |
| Return on Assets | 5.33 % | 6.42 % | 4.04 % |
| Net Margin | 12.29 % | 11.99 % | 7.87 % |
| EBIT Margin | 18.38 % | 18.49 % | 13.09 % |
| EBITDA Margin | 26.70 % | 26.42 % | 20.92 % |
| Gross Margin | 26.96 % | 25.04 % | 21.29 % |
| R&D to Revenue | 0 % | 0 % | 0 % |
Although Vulcan's margins illustrate solid profitability, the absence of R&D expenditures suggests little focus on innovation-driven growth. Its operational efficiency remains commendable, reflected in consistently positive ROE and margins.
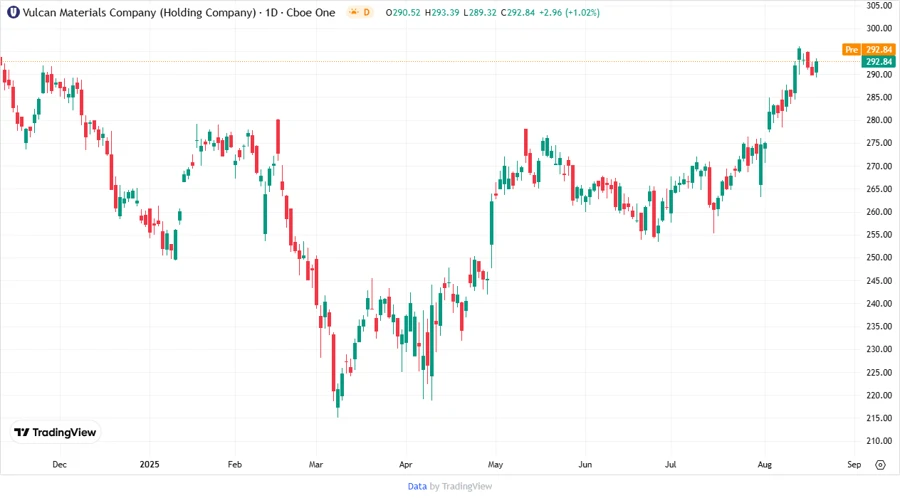
🏦 Price Development
📝 Dividend Scoring System
An objective assessment of Vulcan's dividend potential through a systematic scoring approach.
| Criteria | Score | Score Bar |
|---|---|---|
| Dividend Yield | 2 | |
| Dividend Stability | 5 | |
| Dividend Growth | 3 | |
| Payout Ratio | 5 | |
| Financial stability | 4 | |
| Dividend continuity | 5 | |
| Cashflow Coverage | 4 | |
| Balance Sheet Quality | 4 |
Total Score: 32/40
✅ Rating
Vulcan Materials Company's steady dividend history and prudent financial practices make it a reliable choice for income-oriented investors. While the yield is modest, the company's consistent payment record and sound fiscal strategies indicate promising capabilities for future dividend growth and sustainability.
Smart Data Insight
Master the Perfect Entry & Exit for this Stock
Don't leave your profits to chance. Historically, this stock follows specific seasonal patterns that institutional traders use to maximize returns.
- ✅ Identify the "Golden Buying Window"
- ✅ Avoid high-risk correction cycles
- ✅ Backtested data from the last 20+ years