February 28, 2026 a 04:44 pm
VLTO: Fibonacci Analysis - Veralto Corporation
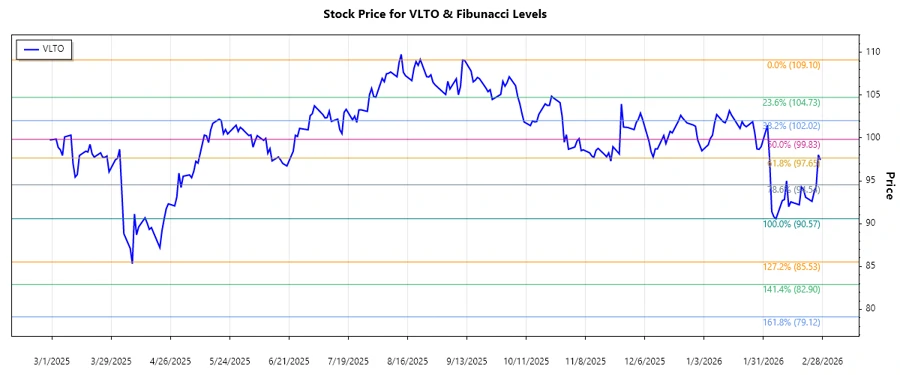
The recent trend for Veralto Corporation's stock (VLTO) indicates a bearish movement from late 2025 into early 2026. The stock price experienced a significant decline from a high of $109.10 in September 2025 to a low of $90.57 in February 2026. Investors should closely monitor the price action around key Fibonacci retracement levels for potential reversal signals.
Fibonacci Analysis
| Feature | Details |
|---|---|
| Trend Start Date | 2025-09-11 |
| Trend End Date | 2026-02-06 |
| Highest Point | $109.10 on 2025-09-11 |
| Lowest Point | $90.57 on 2026-02-06 |
| Fibonacci 0.236 Level | $94.78 |
| Fibonacci 0.382 Level | $97.31 |
| Fibonacci 0.5 Level | $99.84 |
| Fibonacci 0.618 Level | $102.37 |
| Fibonacci 0.786 Level | $105.62 |
| Current Price | $97.43 |
| Retracement Zone | 0.382 |
| Technical Interpretation | The stock is currently in the 0.382 retracement zone, indicating a potential resistance level if the bearish trend continues. A break above this level might suggest the beginning of a bullish reversal. |
Conclusion
The technical analysis of Veralto Corporation (VLTO) reveals a strong downward trend from its peak in September 2025. The current stock price hovers around the 0.382 Fibonacci retracement level, a pivotal point that could determine future price direction. While the price faces resistance at this level, a successful breach might signal a bullish reversal. Investors should be cautious of potential downside risks if the price fails to break this resistance and continues its descent towards the 0.236 level. Overall, the stock remains an intriguing candidate for technical analysts, who might look for confirmation signals before making further investment decisions.