
October 30, 2025 a 11:44 am
VLTO: Fibonacci Analysis - Veralto Corporation
Veralto Corporation has shown a compelling growth trajectory in its stock price, driven by strong performance in its diverse sectors, including water analytics and packaging solutions. With its recent renaming from DH EAS Holding Corp., the company's strategic focus on water quality and digital marking solutions provides robust potential for future expansion. Analysts are closely watching its performance metrics to assess the sustainability of its recent market gains and potential risks from market volatility.
Fibonacci Analysis
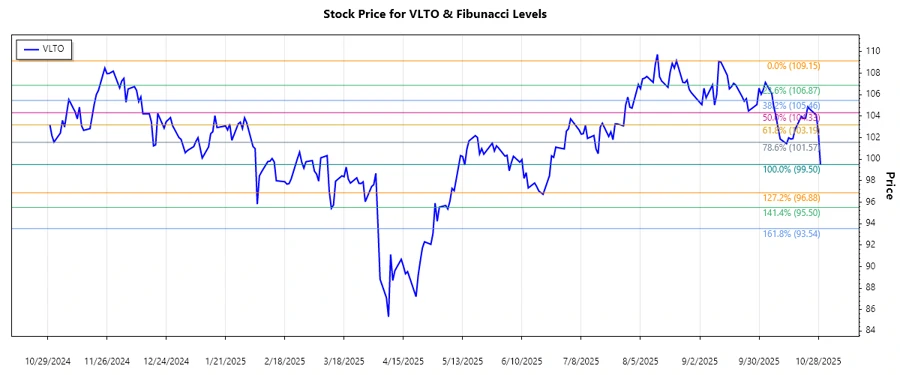
The examined data indicates the latest trend in Veralto Corporation (VLTO) is a downward trend. Beginning from August 22, 2025, with a peak price of $109.15, the price has declined to a low on October 29, 2025, of $99.5. Utilizing Fibonacci retracement, the following key levels have been calculated:
| Trend Period | Details |
|---|---|
| Start Date | 2025-08-22 |
| End Date | 2025-10-29 |
| High (Price/Date) | $109.15 (2025-08-22) |
| Low (Price/Date) | $99.5 (2025-10-29) |
| Fibonacci Level | Price Level |
|---|---|
| 0.236 | $106.74 |
| 0.382 | $105.3 |
| 0.5 | $104.32 |
| 0.618 | $103.34 |
| 0.786 | $102.11 |
The current price is at $99.5, below all key Fibonacci retracement levels, suggesting that it is outside of the significant retracement zones. This breakout downwards could imply further downward momentum or potential resistance at previous retracement levels.
Conclusion
Veralto Corporation has experienced recent volatility, resulting in a downward trend distinct within the market. While potential resistance levels as identified by the Fibonacci retracement could pose challenges, the company’s strong portfolio offers growth opportunities. The current breakout below significant retracement levels highlights the potential for further scrutiny for those considering entry during downward momentum. However, for existing investors, maintaining vigilance on price movement against Fibonacci levels is essential for determining future market strategy and managing risk exposure.
Smart Data Insight
Master the Perfect Entry & Exit for this Stock
Don't leave your profits to chance. Historically, this stock follows specific seasonal patterns that institutional traders use to maximize returns.
- ✅ Identify the "Golden Buying Window"
- ✅ Avoid high-risk correction cycles
- ✅ Backtested data from the last 20+ years