
August 21, 2025 a 06:45 am
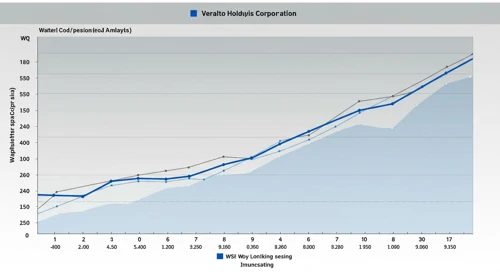

VLTO: Fibonacci Analysis - Veralto Corporation
The Veralto Corporation has demonstrated robust growth prospects, given its innovative solutions in water quality and product quality segments. With its recent corporate restructuring and new branding, it stands poised for further market penetration and growth. Nonetheless, market volatility and macroeconomic factors remain potential challenges.
Fibonacci Analysis
| Start Date | End Date | Low Price (Date) | High Price (Date) |
|---|---|---|---|
| 2025-04-21 | 2025-08-20 | $87.20 (2025-04-21) | $109.75 (2025-08-13) |
| Fibonacci Level | Price Level |
|---|---|
| 0.236 | $103.40 |
| 0.382 | $99.92 |
| 0.5 | $98.48 |
| 0.618 | $97.04 |
| 0.786 | $95.07 |
Current Price is $108.91 and lies outside of retracement zones. This suggests strong support and potential for continued upside momentum, barring external negative factors.
Conclusion
The Veralto Corporation's stock chart analysis reveals a strong upward trend, supported by key Fibonacci retracement levels. Although the stock is currently positioned outside standard retracement zones, thus reflecting bullish sentiment, analysts should remain mindful of potential resistance around the high point. The company's ability to capitalize on its innovative solutions across niche markets may dictate a continued upward trajectory, with macroeconomic factors serving as the primary risks.
Smart Data Insight
Master the Perfect Entry & Exit for this Stock
Don't leave your profits to chance. Historically, this stock follows specific seasonal patterns that institutional traders use to maximize returns.
- ✅ Identify the "Golden Buying Window"
- ✅ Avoid high-risk correction cycles
- ✅ Backtested data from the last 20+ years