
August 23, 2025 a 04:03 am

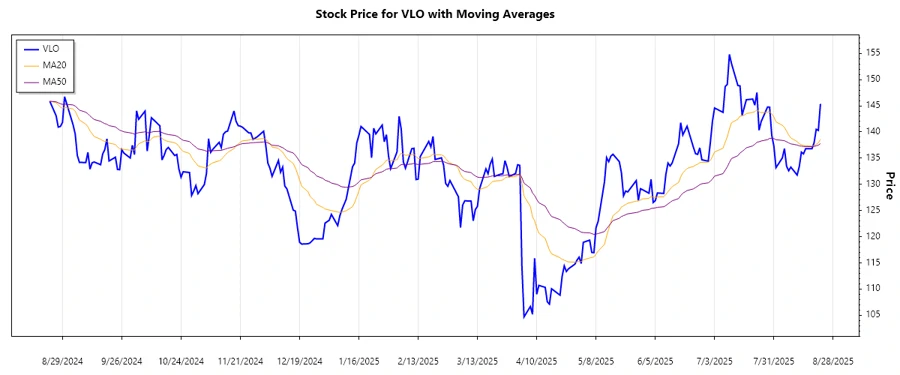
VLO: Trend and Support & Resistance Analysis - Valero Energy Corporation
Valero Energy Corporation is a key player in the energy sector, involved in refining, renewable diesel, and ethanol segments. The company's stock has shown a varied trading pattern, reflecting its ability to adapt to industry shifts and economic conditions. With a robust infrastructure and a wide market presence, Valero's performance is closely tied to global oil and gas trends.
Trend Analysis
| Date | Close Price | Trend |
|---|---|---|
| 2025-08-22 | $145.37 | ▲ |
| 2025-08-21 | $140.29 | ▼ |
| 2025-08-20 | $140.51 | ▲ |
| 2025-08-19 | $137.93 | ▼ |
| 2025-08-18 | $136.81 | ▼ |
| 2025-08-15 | $136.80 | ▼ |
| 2025-08-14 | $135.82 | ▼ |
The last 7 days showcase a mix of upward and downward movements, reflecting cautious trading behavior amidst possible market uncertainties.
Support and Resistance
| Zone | From | To |
|---|---|---|
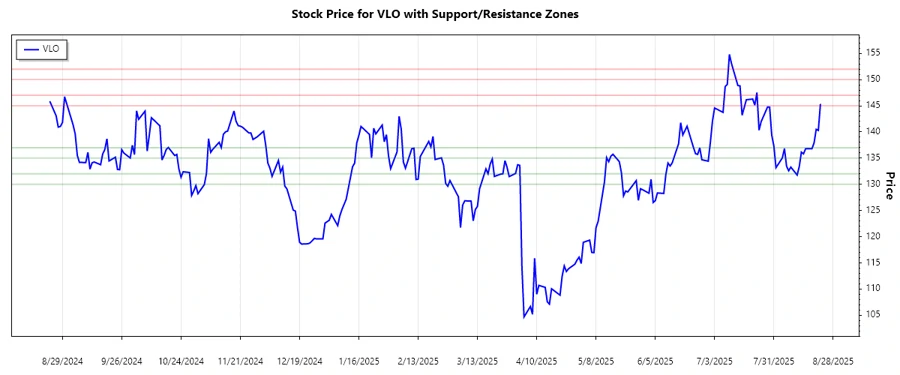
| Support Zone 1 | $135.00 | $137.00 |
| Support Zone 2 | $130.00 | $132.00 |
| Resistance Zone 1 | $145.00 | $147.00 |
| Resistance Zone 2 | $150.00 | $152.00 |
Currently, the price is around the first resistance zone, showing potential for a break or a reversal.
Conclusion
Valero Energy Corporation displays a dynamic trading presence, influenced by complex market forces and industry shifts. Currently, a challenge is presented by the resistance zone that, if broken, could indicate further gains. Conversely, if unbroken, it may signal a possible downturn or sideways movement. Investors should remain vigilant, considering the macroeconomic factors and energy sector trends that can heavily sway Valero's stock performance. Weighing both opportunities in sustainable energy ventures and potential risks in oil market volatility is crucial. Overall, technical indicators provide a balanced perspective.
Smart Data Insight
Master the Perfect Entry & Exit for this Stock
Don't leave your profits to chance. Historically, this stock follows specific seasonal patterns that institutional traders use to maximize returns.
- ✅ Identify the "Golden Buying Window"
- ✅ Avoid high-risk correction cycles
- ✅ Backtested data from the last 20+ years