June 07, 2026 a 02:46 am

VLO: Dividend Analysis - Valero Energy Corporation
Valero Energy Corporation, with its robust dividend history and consistent performance, showcases promising potential for dividend investors. The company's commitment to shareholder returns is evident from its sustained dividend growth over the decades. While the current yield might seem modest, Valero's strategic financial management ensures a stable payout ratio. Investors should consider Valero's sector stability and long-term dividend history as indicative of its ongoing value proposition.
📊 Overview
Valero Energy Corporation operates within the energy sector and maintains a reliable dividend profile, making it an attractive entity for income-focused investors. Here is a detailed view of its dividend metrics:
| Metric | Value |
|---|---|
| Sector | Energy |
| Dividend yield | 1.93 % |
| Current dividend per share | 4.55 USD |
| Dividend history | 41 years |
| Last cut or suspension | None |
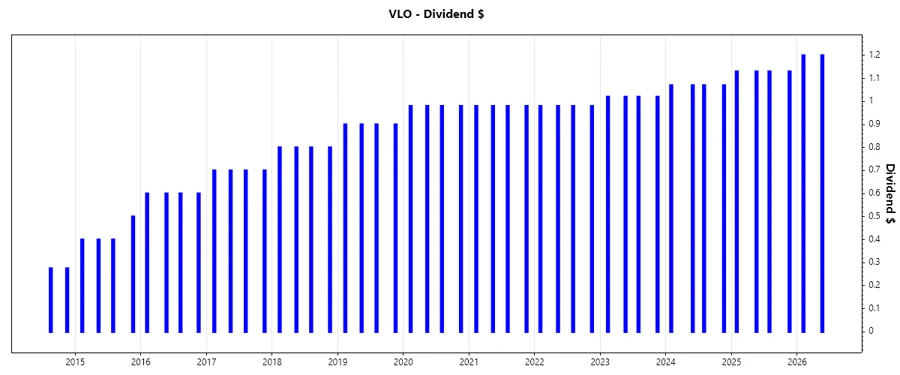
📉 Dividend History
Understanding the dividend history gives insight into the company's commitment to returning value to shareholders. A consistent history of payments over 41 years demonstrates Valero's stability and reliability.
| Year | Dividend per Share (USD) |
|---|---|
| 2026 | 2.40 |
| 2025 | 4.52 |
| 2024 | 4.28 |
| 2023 | 4.08 |
| 2022 | 3.92 |
📈 Dividend Growth
Dividend growth is critical for evaluating the future income potential for investors. Valero's sustained increase in dividends reflects its financial strength and managerial confidence in future earnings.
| Time | Growth |
|---|---|
| 3 years | 4.86 % |
| 5 years | 2.89 % |
The average dividend growth is 2.89 % over 5 years. This shows moderate but steady dividend growth.
✅ Payout Ratio
Understanding how much of the company’s earnings are being paid out as dividends is crucial to evaluating the sustainability of its dividend.
| Key figure | Ratio |
|---|---|
| EPS-based | 32.22 % |
| Free cash flow-based | 22.78 % |
The payout ratios, 32.22 % (EPS) and 22.78 % (FCF), signify a healthy balance between retaining earnings for growth and rewarding shareholders.
💲 Cashflow & Capital Efficiency
Assessing free cash flow and capital efficiency metrics is essential for understanding the company’s ability to generate cash and operate efficiently.
| Year | 2025 | 2024 | 2023 |
|---|---|---|---|
| Free Cash Flow Yield | 10.00 % | 14.63 % | 18.13 % |
| Earnings Yield | 4.67 % | 7.02 % | 19.25 % |
| CAPEX to Operating Cash Flow | 13.66 % | 13.57 % | 9.87 % |
| Stock-based Compensation to Revenue | 0 % | 0.08 % | 0 % |
| Free Cash Flow / Operating Cash Flow Ratio | 86.34 % | 86.43 % | 90.13 % |
Valero demonstrates strong cash flow stability with a consistently high free cash flow yield and efficient capital management.
🗣️ Balance Sheet & Leverage Analysis
A robust balance sheet ensures financial stability and capacity to withstand economic variations. Here is a breakdown of Valero’s financial leverage metrics:
| Year | 2025 | 2024 | 2023 |
|---|---|---|---|
| Debt-to-Equity | 0.49 | 0.47 | 0.48 |
| Debt-to-Assets | 0.20 | 0.19 | 0.20 |
| Debt-to-Capital | 0.33 | 0.32 | 0.32 |
| Net Debt to EBITDA | 1.04 | 0.98 | 0.49 |
| Current Ratio | 1.65 | 1.53 | 1.56 |
| Quick Ratio | 1.11 | 1.03 | 1.11 |
| Financial Leverage | 2.44 | 2.45 | 2.39 |
Valero's financial stability is highlighted by its balanced leverage ratios and high liquidity, providing it a strong position to cover obligations and leverage future growth.
📈 Fundamental Strength & Profitability
Examining profitability ratios, investors can gauge Valero's ability to generate returns efficiently compared to its peers.
| Year | 2025 | 2024 | 2023 |
|---|---|---|---|
| Return on Equity | 9.90 % | 11.30 % | 33.53 % |
| Return on Assets | 4.05 % | 4.61 % | 14.01 % |
| Margins: Net | 1.91 % | 2.13 % | 6.10 % |
| EBIT | 2.90 % | 3.28 % | 8.26 % |
| EBITDA | 5.48 % | 5.41 % | 10.13 % |
| Gross | 4.38 % | 3.66 % | 8.90 % |
| Research & Development to Revenue | 0 % | 0 % | 0 % |
Valero's profitability highlights a robust return potential, with significant ROE and margin figures signaling proficient use of capital and market positioning.
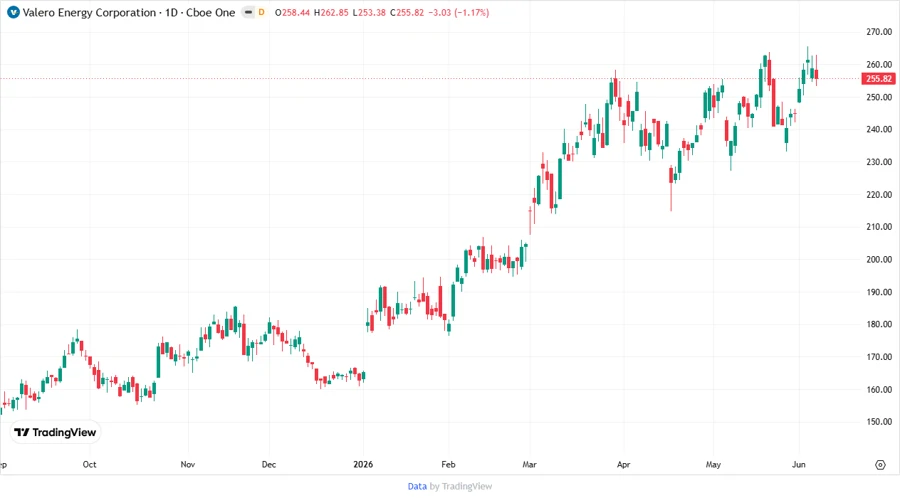
🔄 Price Development
🧐 Dividend Scoring System
This scoring system evaluates Valero's dividend performance across several critical factors, providing a comprehensive view of its investment viability:
| Category | Score | Score Bar |
|---|---|---|
| Dividend yield | 3 | |
| Dividend Stability | 5 | |
| Dividend Growth | 3 | |
| Payout Ratio | 5 | |
| Financial Stability | 4 | |
| Dividend Continuity | 5 | |
| Cashflow Coverage | 4 | |
| Balance Sheet Quality | 4 |
Total Score: 33/40
⚠️ Rating
Valero Energy Corporation emerges as a resilient dividend payer with a robust dividend history and sound financials. Its combination of steady dividend growth and strong payout ratios makes it an alluring pick for dividend-focused portfolios. Investors should find comfort in the company's prudent capital management and commitment to enhancing shareholder value.
Smart Data Insight
Master the Perfect Entry & Exit for this Stock
Don't leave your profits to chance. Historically, this stock follows specific seasonal patterns that institutional traders use to maximize returns.
- ✅ Identify the "Golden Buying Window"
- ✅ Avoid high-risk correction cycles
- ✅ Backtested data from the last 20+ years