December 26, 2025 a 03:31 am
VLO: Dividend Analysis - Valero Energy Corporation
Valero Energy Corporation presents a stable dividend profile with over 40 years of dividend history. The company's commitment to maintaining consistent dividends is underscored by its strong financial metrics and prudent management practices. This analysis delves into key financial aspects that influence Valero's dividend sustainability and growth potential.
Overview
Valero Energy Corporation operates within the energy sector, delivering a competitive dividend yield of 2.65%. With a current dividend per share of 4.30 USD and an impressive 40 years of dividend history, the company portrays a robust dividend outlook. The last recorded dividend cut was over a decade ago, in 2010, reflecting its financial resilience.
| Category | Details |
|---|---|
| Sector | Energy |
| Dividend Yield | 2.65% |
| Current Dividend per Share | 4.30 USD |
| Dividend History | 40 years |
| Last Cut or Suspension | 2010 |
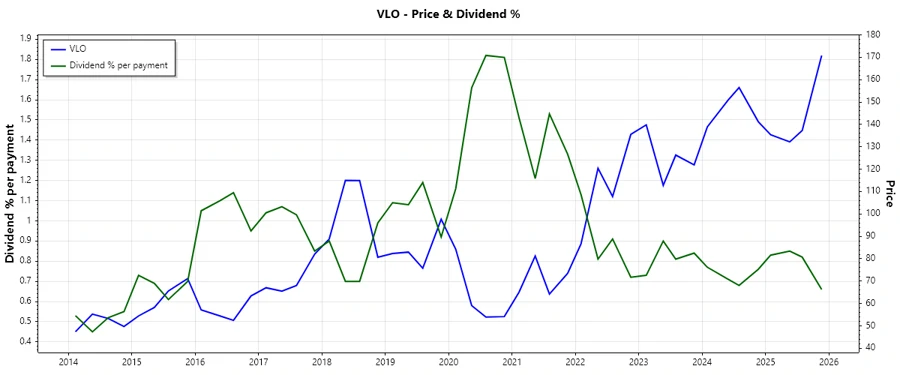
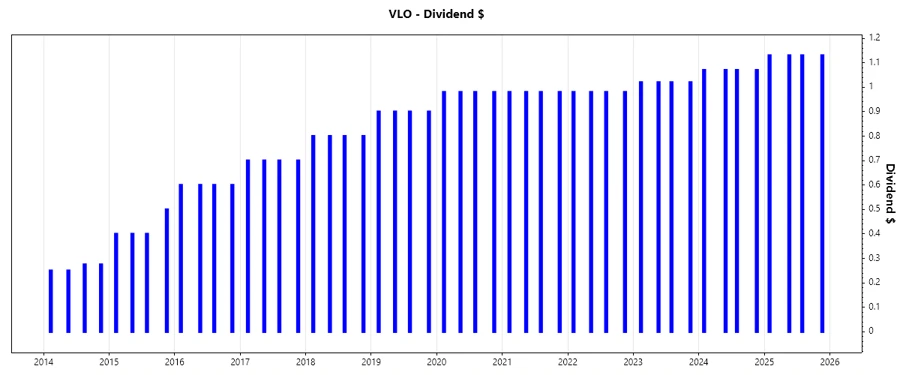
Dividend History
Valero's dividend history showcases a reliable track record of payouts. This stability is critical for income-focused investors seeking consistent returns. Below is a visual representation followed by recent dividend payments, highlighting the company's commitment to shareholder value.
| Year | Dividend per Share (USD) |
|---|---|
| 2025 | 4.52 |
| 2024 | 4.28 |
| 2023 | 4.08 |
| 2022 | 3.92 |
| 2021 | 3.92 |
Dividend Growth
The dividend growth rate is a crucial indicator of future yield potential and investor return. Valero's moderate growth rates over the past 3 and 5 years demonstrate a balanced approach between rewarding shareholders and reinvesting for future growth.
| Time | Growth |
|---|---|
| 3 years | 2.97% |
| 5 years | 3.52% |
The average dividend growth is 3.52% over 5 years. This shows moderate but steady dividend growth.
Payout Ratio
Payout ratios help assess the sustainability of dividends relative to earnings and free cash flow. Valero's payout ratios suggest a balanced approach towards income distribution and growth investment.
| Key Figure | Ratio |
|---|---|
| EPS-based | 90.60% |
| Free cash flow-based | 30.79% |
The payout ratio based on EPS is relatively high at 90.60%, indicating a full distribution of earnings. However, the FCF-based payout ratio remains conservative at 30.79%, highlighting sufficient coverage and prudent management.
Cashflow & Capital Efficiency
Cash flow metrics provide insights into the liquidity and operational efficiency of Valero. A strong free cash flow yield coupled with efficient capital allocation underscores the company's financial health.
| Category | 2022 | 2023 | 2024 |
|---|---|---|---|
| Free Cash Flow Yield | 21.74% | 18.13% | 14.63% |
| Earnings Yield | 23.01% | 19.25% | 7.02% |
| CAPEX to Operating Cash Flow | 13.37% | 9.87% | 13.57% |
| Stock-based Compensation to Revenue | 0.06% | 0.00% | 0.08% |
| Free Cash Flow / Operating Cash Flow Ratio | 86.63% | 90.13% | 86.43% |
The data suggests robust cash flow stability and effective capital management, vital for sustaining dividend payouts and funding growth initiatives.
Balance Sheet & Leverage Analysis
Analyzing balance sheet strength is crucial to assess a company's financial risk profile and leverage for growth. Valero's metrics reveal a well-managed debt profile.
| Category | 2022 | 2023 | 2024 |
|---|---|---|---|
| Debt-to-Equity | 53.99% | 47.97% | 47.08% |
| Debt-to-Assets | 20.86% | 20.04% | 19.19% |
| Debt-to-Capital | 35.06% | 32.42% | 32.01% |
| Net Debt to EBITDA | 0.43 | 0.49 | 0.98 |
| Current Ratio | 1.38 | 1.56 | 1.53 |
| Quick Ratio | 1.00 | 1.11 | 1.03 |
| Financial Leverage | 2.59 | 2.39 | 2.45 |
The financial stability and leverage analysis depict Valero's prudent financial strategies, indicating strong liquidity and a manageable debt burden that supports its operations and dividend policy.
Fundamental Strength & Profitability
Profitability measures indicate Valero's capability to generate sustainable earnings and return on investments. High margins and returns highlight excellent operational performance.
| Category | 2022 | 2023 | 2024 |
|---|---|---|---|
| Return on Equity | 48.93% | 33.53% | 11.30% |
| Return on Assets | 18.90% | 14.01% | 4.61% |
| Net Profit Margin | 6.54% | 6.10% | 2.13% |
| EBIT Margin | 9.00% | 8.26% | 3.28% |
| EBITDA Margin | 10.40% | 10.13% | 5.41% |
| Gross Margin | 9.50% | 8.90% | 3.66% |
| R&D to Revenue | 0.00% | 0.00% | 0.00% |
Valero's strong profitability metrics reflect its capability to optimize revenues effectively, substantiated by impressive returns on equity and assets. This assures continuous competitive positioning and shareholder value.
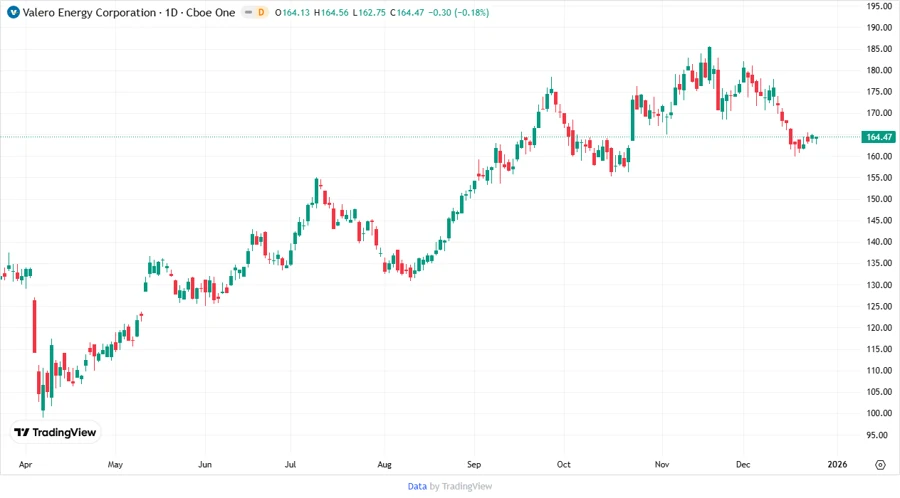
Price Development
Dividend Scoring System
| Criteria | Score (1-5) | Score Bar |
|---|---|---|
| Dividend yield | 4 | |
| Dividend Stability | 5 | |
| Dividend growth | 3 | |
| Payout ratio | 3 | |
| Financial stability | 4 | |
| Dividend continuity | 5 | |
| Cashflow Coverage | 4 | |
| Balance Sheet Quality | 4 |
Overall Score: 32/40
Rating
Valero Energy Corporation presents a solid dividend profile characterized by stable payouts, moderate growth, and prudent financial management. The company's financial metrics suggest sustainability in dividend policies, making it a compelling choice for income-focused investors.