October 04, 2025 a 07:32 am

VLO: Dividend Analysis - Valero Energy Corporation
Valero Energy Corporation is a significant player in the energy sector, primarily engaged in refining and marketing. It's renowned for its steady track record of dividend payments, with over 40 years of consistent history. Its current dividend yield is attractive for income-focused investors, although the payout ratio indicates a need for caution, as the EPS-based ratio is notably high. Overall, Valero's dividends appear sustainable, supported by a resilient cash flow, but close monitoring of its payout sustainability is advisable.
📊 Overview
| Detail | Value |
|---|---|
| Sector | Energy |
| Dividend Yield | 3.25% |
| Current Dividend per Share | 4.30 USD |
| Dividend History | 40 years |
| Last Cut or Suspension | None |
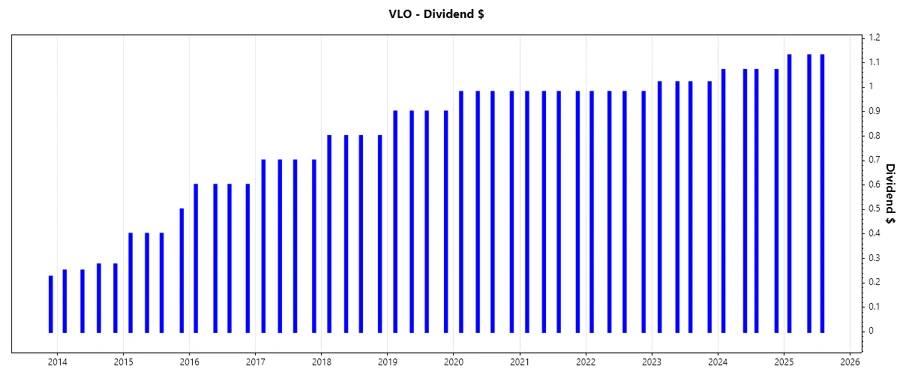
🗣️ Dividend History
The history of Valero Energy's dividends is impressive with over four decades of continuous payments, signaling a robust commitment to returning capital to shareholders. This reputation contributes to the company’s reliability and investor confidence.
| Year | Dividend per Share |
|---|---|
| 2025 | 3.39 |
| 2024 | 4.28 |
| 2023 | 4.08 |
| 2022 | 3.92 |
| 2021 | 3.92 |
📈 Dividend Growth
Dividend growth is a critical metric for assessing a company's future dividend capabilities and financial health. Valero exhibits modest but consistent dividend growth over recent years, hinting at a balanced growth strategy.
| Time | Growth |
|---|---|
| 3 years | 2.97% |
| 5 years | 3.52% |
The average dividend growth is 3.52% over 5 years. This shows moderate but steady dividend growth.
📉 Payout Ratio
A company’s payout ratio provides insight into the sustainability of its dividends. With an EPS-based payout ratio of 175.53%, Valero might struggle in the long term if earnings do not improve. Conversely, the Free Cash Flow payout ratio of 35.70% suggests more stability and flexibility.
| Key figure | Ratio |
|---|---|
| EPS-based | 175.53% |
| Free cash flow-based | 35.70% |
The discrepancy between the EPS payout and FCF payout highlights areas of concern regarding earnings but suggests resilience in cash flow coverage.
✅ Cashflow & Capital Efficiency
An analysis of cash flow and capital efficiency is essential for understanding a company's capacity to support its dividends and reinvest for growth. The below ratios illustrate Valero's performance in these critical operational areas.
| Year | 2024 | 2023 | 2022 |
|---|---|---|---|
| Free Cash Flow Yield | 0.15 | 0.18 | 0.22 |
| Earnings Yield | 0.07 | 0.19 | 0.23 |
| CAPEX to Operating Cash Flow | 0.14 | 0.10 | 0.13 |
| Stock-based Compensation to Revenue | 0.0008 | 0 | 0.0006 |
| Free Cash Flow / Operating Cash Flow Ratio | 0.86 | 0.90 | 0.87 |
Valero's free cash flow yield and efficient capital allocation metrics indicate a stable financial platform capable of maintaining its dividend strategy despite potential earnings pressures.
⚠️ Balance Sheet & Leverage Analysis
Balance sheet and leverage ratios provide insight into Valero's capital structure and its ability to meet debts, vital for long-term financial health.
| Year | 2024 | 2023 | 2022 |
|---|---|---|---|
| Debt-to-Equity | 0.47 | 0.48 | 0.54 |
| Debt-to-Assets | 0.19 | 0.20 | 0.21 |
| Debt-to-Capital | 0.32 | 0.32 | 0.35 |
| Net Debt to EBITDA | 0.98 | 0.49 | 0.43 |
| Current Ratio | 1.53 | 1.56 | 1.38 |
| Quick Ratio | 1.03 | 1.11 | 1.00 |
| Financial Leverage | 2.45 | 2.39 | 2.59 |
The leverage metrics display a sound balance sheet with manageable debt levels, supporting financial stability. The current ratio suggests ample liquidity to cover short-term obligations.
✅ Fundamental Strength & Profitability
The following profitability ratios measure Valero's ability to generate earnings relative to its revenue, assets, and equity, serving as key indicators of financial efficiency and effectiveness.
| Year | 2024 | 2023 | 2022 |
|---|---|---|---|
| Return on Equity | 0.11 | 0.34 | 0.49 |
| Return on Assets | 0.05 | 0.14 | 0.19 |
| Net Margin | 0.02 | 0.06 | 0.07 |
| EBIT Margin | 0.03 | 0.08 | 0.09 |
| EBITDA Margin | 0.05 | 0.10 | 0.10 |
| Gross Margin | 0.04 | 0.09 | 0.09 |
Valero’s profitability margins indicate a healthy operational structure, with strong returns on equity, assets, and invested capital, reflecting effective asset management and cost controls.
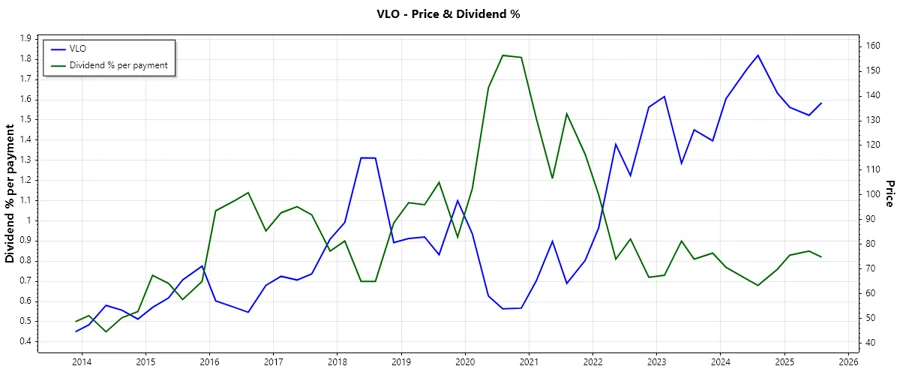
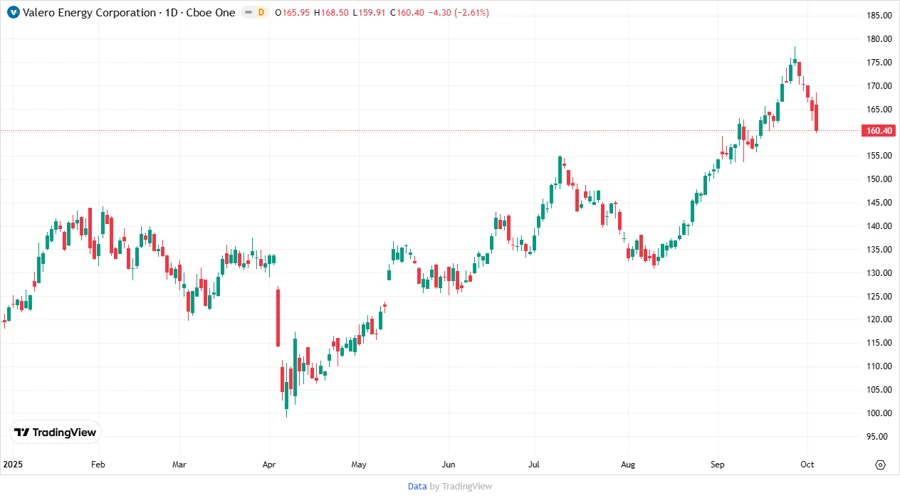
📈 Price Development
🗣️ Dividend Scoring System
| Category | Score (1-5) | Score Bar |
|---|---|---|
| Dividend Yield | 4 | |
| Dividend Stability | 5 | |
| Dividend Growth | 3 | |
| Payout Ratio | 2 | |
| Financial Stability | 4 | |
| Dividend Continuity | 5 | |
| Cashflow Coverage | 4 | |
| Balance Sheet Quality | 4 |
Total Score: 31/40
Rating
In conclusion, Valero Energy Corporation presents a viable investment opportunity for dividend-seeking investors, owing to its consistent dividend payments and relatively strong financial metrics. However, attention should be given to earnings sustainability and the high EPS payout ratio. Overall, Valero offers a compelling blend of yield and growth potential with an emphasis on stable cash flows and financial stability.
Smart Data Insight
Master the Perfect Entry & Exit for this Stock
Don't leave your profits to chance. Historically, this stock follows specific seasonal patterns that institutional traders use to maximize returns.
- ✅ Identify the "Golden Buying Window"
- ✅ Avoid high-risk correction cycles
- ✅ Backtested data from the last 20+ years