July 29, 2025 a 11:31 am
VLO: Dividend Analysis - Valero Energy Corporation
Valero Energy Corporation (VLO) exhibits a robust dividend profile, punctuated by an impressive 40-year history of uninterrupted dividends. The company's moderate but steady dividend growth over the past 5 years underscores its commitment to rewarding shareholders, making it an appealing investment for those seeking consistent returns. However, its relatively high EPS-based payout ratio suggests careful monitoring moving forward.
📊 Overview
Valero Energy Corporation (VLO) operates within the energy sector, delivering a dividend yield of 3.08% with a current dividend per share of 4.30 USD. The company boasts a remarkable 40-year track record of dividend payments, with no recent cuts or suspensions—a testament to its stability.
| Category | Details |
|---|---|
| Sector | Energy |
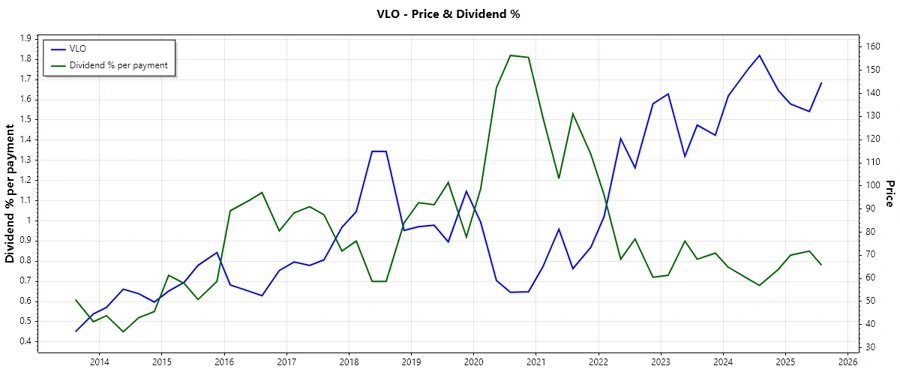
| Dividend yield | 3.08% |
| Current dividend per share | 4.30 USD |
| Dividend history | 40 years |
| Last cut or suspension | None |
🗣️ Dividend History
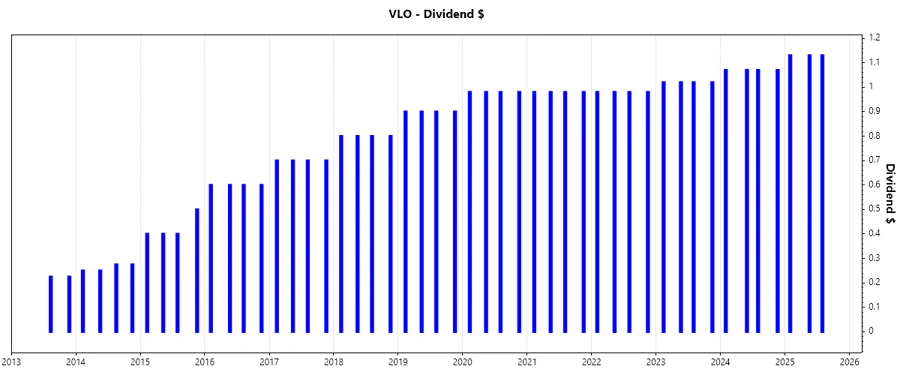
The dividend history of Valero Energy Corporation reveals an impressive track record of stability and reliability, critical for income-focused investors. Consistent dividend payments over decades indicate the company's robust financial health and commitment to shareholder returns.
| Year | Dividend per Share (USD) |
|---|---|
| 2025 | 3.39 |
| 2024 | 4.28 |
| 2023 | 4.08 |
| 2022 | 3.92 |
| 2021 | 3.92 |
📈 Dividend Growth
Valero Energy Corporation showcases a pattern of moderate yet steady dividend growth, critical in building wealth through reinvestment. Tracking the growth over the last 3 and 5 years offers insight into future potential and management confidence in cash flow allocations.
| Time | Growth |
|---|---|
| 3 years | 2.97% |
| 5 years | 3.52% |
The average dividend growth is 3.52% over 5 years. This shows moderate but steady dividend growth.
📉 Payout Ratio
Understanding Valero Energy Corporation's payout ratios is essential to gauge dividend sustainability. An EPS-based ratio of 175.53% paired with a more reasonable FCF-based ratio of 35.70% suggests potential pressure on earnings if not managed carefully.
| Key figure | Ratio |
|---|---|
| EPS-based | 175.53% |
| Free cash flow-based | 35.70% |
The elevated EPS-based payout suggests that while cash flow coverage remains adequate, ongoing diligence is advised regarding earnings volatility.
🔍 Cashflow & Capital Efficiency
These metrics provide insight into how effectively Valero manages its cash and investment returns. High free cash flow yield relative to earnings yield denotes strong cash efficiency, crucial for funding dividends and future growth.
| Metric | 2024 | 2023 | 2022 |
|---|---|---|---|
| Free Cash Flow Yield | 14.63% | 18.13% | -2.04% |
| Earnings Yield | 7.02% | 19.25% | 23.01% |
| CAPEX to Operating Cash Flow | 13.57% | 9.87% | 254.31% |
| Stock-based Compensation to Revenue | 0.01% | 0% | 0.06% |
| Free Cash Flow / Operating Cash Flow Ratio | 86.43% | 90.13% | -154.31% |
Valero Energy Corporation demonstrates strong cash flow generation capability, albeit with some aberrations in years with high CAPEX investments, necessitating close monitoring of capital efficiency and resource allocation.
🧮 Balance Sheet & Leverage Analysis
A closer examination of leverage ratios is essential for understanding financial risk. Valero's moderately leveraged position combined with favorable interest coverage ratios indicates prudent financial management.
| Metric | 2024 | 2023 | 2022 |
|---|---|---|---|
| Debt-to-Equity | 0.47 | 0.48 | 0.54 |
| Debt-to-Assets | 0.19 | 0.20 | 0.21 |
| Debt-to-Capital | 0.32 | 0.32 | 0.35 |
| Net Debt to EBITDA | 0.98 | 0.49 | 0.43 |
| Current Ratio | 1.53 | 1.56 | 1.38 |
| Quick Ratio | 1.03 | 1.11 | 1.00 |
| Financial Leverage | 2.45 | 2.39 | 2.59 |
Valero's leverage ratios reflect moderate financial risk with ample liquidity coverage, supporting the company's capital structure and interest obligations efficiently.
🪙 Fundamental Strength & Profitability
Valero Energy's profitability metrics and returns on capital provide essential insights into its operational efficiency and financial health, vital for assessing shareholder value generation.
| Metric | 2024 | 2023 | 2022 |
|---|---|---|---|
| Return on Equity | 11.30% | 33.53% | 48.93% |
| Return on Assets | 4.61% | 14.01% | 18.90% |
| Net Profit Margin | 2.13% | 6.10% | 6.54% |
| EBIT Margin | 3.28% | 8.26% | 8.99% |
| EBITDA Margin | 5.41% | 10.13% | 10.40% |
| Gross Margin | 3.66% | 8.91% | 9.50% |
| Research & Development to Revenue | 0% | 0% | 0% |
The strong return metrics suggest efficient use of capital and significant potential for yielding positive returns to shareholders, despite the challenges in volatile markets.
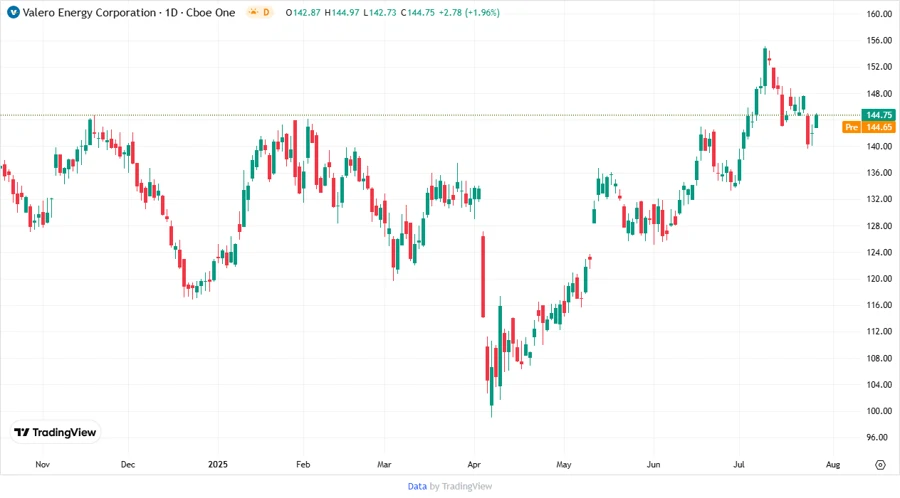
💹 Price Development
✅ Dividend Scoring System
| Criteria | Score | Score Bar |
|---|---|---|
| Dividend yield | 3 | |
| Dividend Stability | 5 | |
| Dividend growth | 3 | |
| Payout ratio | 2 | |
| Financial stability | 4 | |
| Dividend continuity | 5 | |
| Cashflow Coverage | 4 | |
| Balance Sheet Quality | 4 |
Total Score: 30/40
⭐ Rating
In conclusion, Valero Energy Corporation offers a balanced dividend profile appealing to those seeking consistent yields with moderate growth. While the high EPS-based payout ratio warrants a cautious outlook, the overall financial stability and strong dividend continuity make VLO a solid candidate for income-focused portfolios.
Smart Data Insight
Master the Perfect Entry & Exit for this Stock
Don't leave your profits to chance. Historically, this stock follows specific seasonal patterns that institutional traders use to maximize returns.
- ✅ Identify the "Golden Buying Window"
- ✅ Avoid high-risk correction cycles
- ✅ Backtested data from the last 20+ years