May 24, 2025 a 04:03 am


VICI: Trend and Support & Resistance Analysis - VICI Properties Inc.
VICI Properties Inc., a prominent real estate investment trust, offers a versatile portfolio of gaming, hospitality, and entertainment properties, such as the distinguished Caesars Palace. Recent technical analysis suggests a mixed trend with both opportunities and risks. Investors should consider the latest support and resistance levels, alongside market conditions, to inform their investment decisions proactively.
Trend Analysis
The recent trend analysis based on exponential moving averages (EMA) over the last few months indicates a period of fluctuation. The calculation of EMA20 and EMA50 gives us insights into potential trend shifts.
| Date | Close Price | Trend |
|---|---|---|
| 2025-05-23 | 31.47 | ▼ Abwärtstrend |
| 2025-05-22 | 31.20 | ▼ Abwärtstrend |
| 2025-05-21 | 31.36 | ▲ Aufwärtstrend |
| 2025-05-20 | 31.92 | ▲ Aufwärtstrend |
| 2025-05-19 | 32.15 | ▲ Aufwärtstrend |
| 2025-05-16 | 32.10 | ▲ Aufwärtstrend |
| 2025-05-15 | 31.63 | ▼ Abwärtstrend |
Given the EMA calculations, VICI Properties Inc. stock is exhibiting a short-term upward momentum despite recent pullbacks, signaling potential bullish activity, though caution is advised.
Support and Resistance
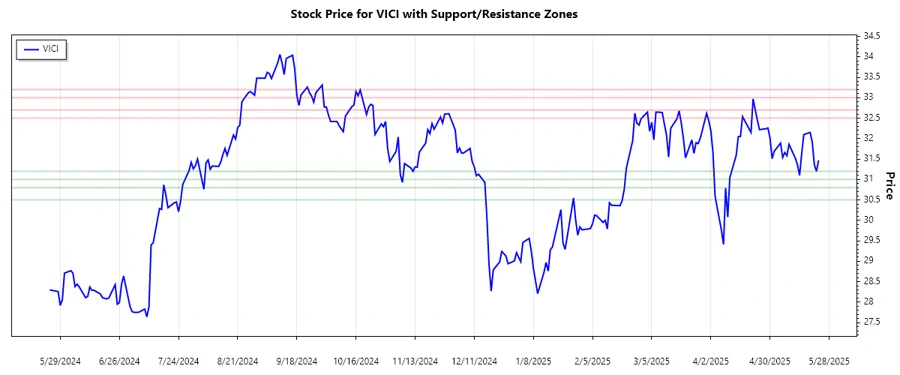
Based on historical price data, important support and resistance levels have been calculated to provide investors with potential entry and exit points.
| Type | From | To |
|---|---|---|
| Support 1 | 30.50 | 30.80 |
| Support 2 | 31.00 | 31.20 |
| Resistance 1 | 32.50 | 32.70 |
| Resistance 2 | 33.00 | 33.20 |
The current close price appears to be within a resistance zone, potentially limiting further upward movement until this level is surpassed.
Conclusion
VICI Properties Inc. demonstrates potential for upward movement significant to technical analysis informed buyers. With the stock situated in a resistance zone, a potential breakout could yield lucrative opportunities. However, investors should remain vigilant of market volatility and broader economic influences that might impact the stock's trajectory.
Smart Data Insight
Master the Perfect Entry & Exit for this Stock
Don't leave your profits to chance. Historically, this stock follows specific seasonal patterns that institutional traders use to maximize returns.
- ✅ Identify the "Golden Buying Window"
- ✅ Avoid high-risk correction cycles
- ✅ Backtested data from the last 20+ years