May 06, 2026 a 11:44 am
VICI: Fibonacci Analysis - VICI Properties Inc.
The VICI Properties Inc. stock has shown significant fluctuations over the past months, mainly characterized by an overall downward trend. The company, known for its diversified portfolio in gaming and hospitality real estate, faces challenges due to market volatility. However, its stable leasing agreements with industry leaders provide a buffer against market downturns but are still not immune to broader economic impacts. Investors should remain cautious while analyzing potential entry points, given the current stock valuation.
Fibonacci Analysis
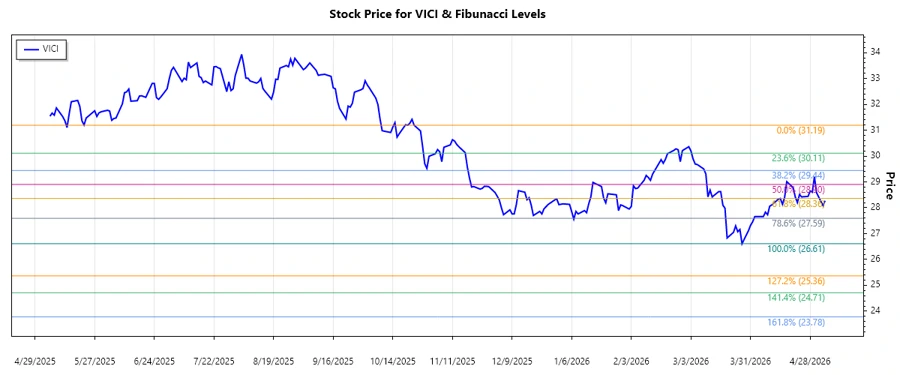
The analysis focuses on the recent downward trend observed in the VICI Properties Inc. stock. Based on the data from February 13, 2026, to May 5, 2026, the stock has experienced notable highs and lows.
| Start Date | End Date | High Price | Low Price |
|---|---|---|---|
| 2025-11-11 | 2026-05-05 | $31.19 (2025-10-23) | $26.61 (2026-03-27) |
Below are the calculated Fibonacci Retracement Levels based on the identified high and low points:
| Fibonacci Level | Price |
|---|---|
| 0.236 | $27.50 |
| 0.382 | $28.17 |
| 0.5 | $28.90 |
| 0.618 | $29.63 |
| 0.786 | $30.49 |
As of the latest data, the current price is within the $28.17 range, indicating the stock may be experiencing a 0.382 Fibonacci retracement. This zone often acts as a support level and could potentially indicate a short-term reversal.
Conclusion
In summary, the recent downtrend of VICI Properties Inc. is supported by broad market influences impacting the real estate investment trust sector. The stock is presently within a retracement zone, suggesting a potential reversal or stabilization in the near term. While the company maintains strong leasing agreements and a diversified property portfolio, the overall market volatility presents risks. Investors should carefully evaluate their strategies while considering opportunities to capitalize on potential upticks during this retracement phase.
Smart Data Insight
Master the Perfect Entry & Exit for this Stock
Don't leave your profits to chance. Historically, this stock follows specific seasonal patterns that institutional traders use to maximize returns.
- ✅ Identify the "Golden Buying Window"
- ✅ Avoid high-risk correction cycles
- ✅ Backtested data from the last 20+ years