November 01, 2025 a 03:15 pm

VICI: Fibonacci Analysis - VICI Properties Inc.
VICI Properties Inc. is a prominent real estate investment trust (REIT) that specializes in gaming, hospitality, and entertainment destinations. Utilizing its strategic partnerships with leading operators, the company maintains a geographically diverse portfolio. Despite recent fluctuations, VICI showcases resilience attributed to the expanding gaming and leisure industries. Technical analysis reveals nuanced insights into its market trajectory amidst these dynamics.
Fibonacci Analysis
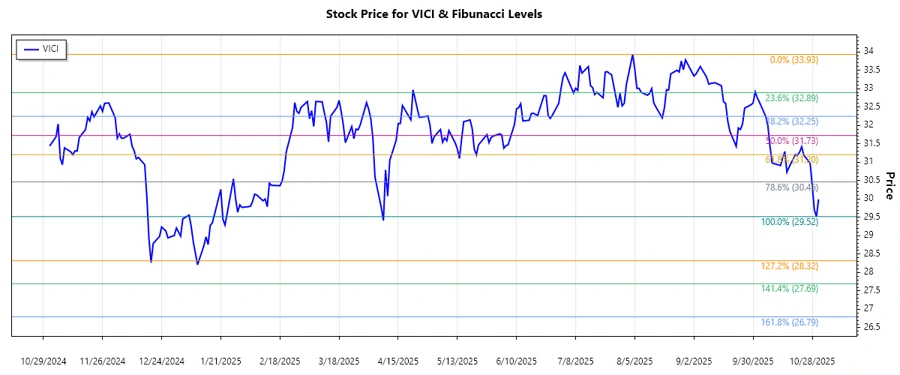
The stock of VICI Properties Inc. experienced a dominant downtrend from a high of $33.93 on 2025-08-04 to a low of $29.52 on 2025-10-30. Using this trend for a Fibonacci Retracement analysis, we calculate the following retracement levels.
| Data Point | Value |
|---|---|
| Start Date | 2025-08-04 |
| End Date | 2025-10-30 |
| High Price | $33.93 |
| Low Price | $29.52 |
| Current Price | $29.99 |
| Fibonacci 23.6% | $30.66 |
| Fibonacci 38.2% | $31.38 |
| Fibonacci 50.0% | $31.72 |
| Fibonacci 61.8% | $32.06 |
| Fibonacci 78.6% | $32.61 |
| Current Retracement Zone | None |
| Technical Interpretation | The stock remains below the 23.6% retracement level, indicating prevailing bearish sentiment. A break above this level could signal the beginning of a recovery or serve as a temporary resistance. |
Conclusion
VICI Properties Inc. shows a strong inclination towards a bearish trend, predominantly traded below the key Fibonacci retracement levels. As the current price levels hover below the 23.6% mark, it indicates lingering bearish pressure, emboldening short-sellers. The potential for a reversal remains contingent on breaching initial resistance points, which could re-attract investor confidence. However, should the stock persist below these thresholds, it may face further downward pressure. Analysts should monitor volume trends and broader market conditions to assess upcoming price movements effectively.
Smart Data Insight
Master the Perfect Entry & Exit for this Stock
Don't leave your profits to chance. Historically, this stock follows specific seasonal patterns that institutional traders use to maximize returns.
- ✅ Identify the "Golden Buying Window"
- ✅ Avoid high-risk correction cycles
- ✅ Backtested data from the last 20+ years