December 11, 2025 a 12:46 pm


VICI: Dividend Analysis - VICI Properties Inc.
VICI Properties Inc. represents a robust dividend profile with an appealing yield within the REIT sector. Despite current yield volatility in the market, VICI's track record shows promising stability and growth, making it an attractive option for income-focused investors. The company’s disciplined payout strategy appears sustainable, supported by a healthy balance sheet and effective capital management strategies.
📊 Overview
VICI Properties Inc. stands out in the REIT sector with a competitive dividend yield and a consistent history of payments.
| Category | Data |
|---|---|
| Sector | Real Estate Investment Trusts (REITs) |
| Dividend Yield | 6.36% |
| Current Dividend per Share | 1.67 USD |
| Dividend History | 8 years |
| Last Cut or Suspension | None |
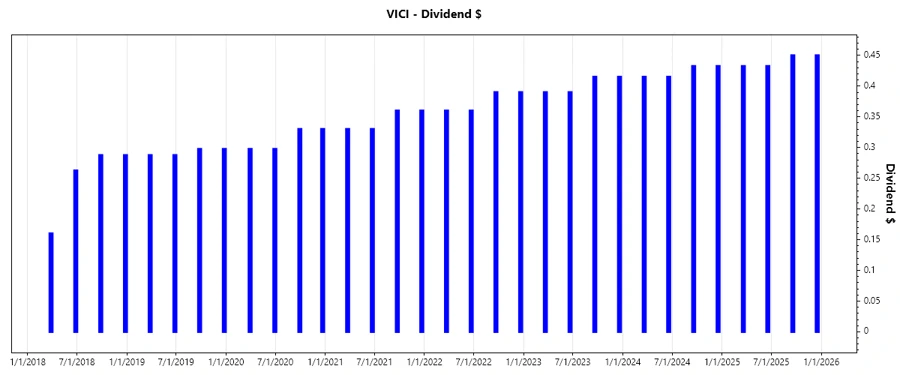
📈 Dividend History
An analysis of VICI's recent dividend history illustrates consistent growth, underscoring management's commitment to shareholder returns. The consistency is crucial in establishing investor trust and ensuring stable returns in varying economic climates.
| Year | Dividend per Share (USD) |
|---|---|
| 2025 | 1.7650 |
| 2024 | 1.6950 |
| 2023 | 1.6100 |
| 2022 | 1.5000 |
| 2021 | 1.3800 |
📈 Dividend Growth
The growth trajectory in VICI's dividends emphasizes steady appreciation, making it attractive for long-term dividend growth investors. Robust growth percentages further enhance the attractiveness of its dividend profile.
| Time | Growth |
|---|---|
| 3 years | 7.09% |
| 5 years | 7.70% |
The average dividend growth is 7.70% over 5 years. This shows moderate but steady dividend growth.
✅ Payout Ratio
The payout ratio is a vital indicator for assessing the sustainability of a company's dividend payouts. VICI's payout ratios reflect a prudent balance between investor returns and retaining capital for growth.
| Key Figure | Ratio |
|---|---|
| EPS-based | 64.17% |
| Free Cash Flow-based | 72.73% |
The EPS payout ratio of 64.17% and FCF payout ratio of 72.73% suggest a healthy balance between reinvestment and reward to shareholders, supporting the company’s long-term growth objectives.
💰 Cashflow & Capital Efficiency
The evaluation of cash flow and capital efficiency provides insights into the company's operational effectiveness and potential for sustainable growth. VICI showcases a strong capacity to generate free cash, complemented by efficient capital management.
| Indicator | 2024 | 2023 | 2022 |
|---|---|---|---|
| Free Cash Flow Yield | 7.76% | 6.73% | 6.83% |
| Earnings Yield | 8.76% | 7.77% | 3.93% |
| CAPEX to Operating Cash Flow | 0.04% | 0.19% | 0.10% |
| Stock-based Compensation to Revenue | 0.45% | 0.43% | 0.50% |
| Free Cash Flow / Operating Cash Flow Ratio | 99.68% | 99.81% | 99.90% |
VICI's cash flow metrics underscore a robust operational framework and a balanced capital deployment strategy, enhancing investor confidence.
💼 Balance Sheet & Leverage Analysis
Understanding the leverage and financial structure of VICI is essential in gauging risk and sustainability of growth. The ratios highlight a well-managed debt profile.
| Indicator | 2024 | 2023 | 2022 |
|---|---|---|---|
| Debt-to-Equity | 66.51% | 69.80% | 66.42% |
| Debt-to-Assets | 38.90% | 40.01% | 38.77% |
| Debt-to-Capital | 39.94% | 41.11% | 39.91% |
| Net Debt to EBITDA | 4.80x | 5.07x | 8.54x |
| Current Ratio | 2.78 | 28.22 | 28.97 |
| Quick Ratio | 27.92 | 28.22 | 28.97 |
The balance sheet data indicates a manageable level of leverage, maintaining financial flexibility and liquidity to support ongoing operations and liabilities.
📊 Fundamental Strength & Profitability
Analyzing fundamental performance metrics provides insights into company's operational efficiencies and profitability. VICI demonstrates solid profit-generating capabilities.
| Indicator | 2024 | 2023 | 2022 |
|---|---|---|---|
| Return on Equity | 10.09% | 9.95% | 5.10% |
| Return on Assets | 5.90% | 5.70% | 2.97% |
| Net Margin | 69.59% | 69.59% | 42.97% |
| EBIT Margin | 92.41% | 93.20% | 64.56% |
| EBITDA Margin | 92.52% | 93.32% | 64.69% |
| Gross Margin | 99.30% | 99.25% | 99.13% |
| R&D to Revenue | 0% | 0% | 0% |
VICI's fundamental performance, highlighted by high margins and efficiency ratios, indicates a strong ability to sustain profitability and competitive positioning.
📉 Price Development
📊 Dividend Scoring System
| Criteria | Score | Chart |
|---|---|---|
| Dividend yield | 5 | |
| Dividend Stability | 4 | |
| Dividend Growth | 4 | |
| Payout Ratio | 4 | |
| Financial Stability | 5 | |
| Dividend Continuity | 5 | |
| Cashflow Coverage | 4 | |
| Balance Sheet Quality | 5 |
Overall Score: 36/40
🗣️ Rating & Recommendation
VICI Properties Inc. earns a favorable evaluation for its strong dividend yield, sustainable payout ratios, consistent growth history, and solid financial health. With an overall score of 36 out of 40, VICI is recommended as a strong buy for dividend-focused investors seeking stable income with growth potential.