November 11, 2025 a 07:46 am


VICI: Dividend Analysis - VICI Properties Inc.
VICI Properties Inc. is an attractive option for income-focused investors due to its consistent dividend payments and strong dividend yield. The company shows robust financial metrics that suggest its dividends are well-supported by earnings and cash flows. As it stands, VICI displays growth potential, making it suitable for those looking for both income and moderate capital appreciation.
📊 Overview
VICI Properties operates within the real estate sector and offers an impressive dividend yield of 5.44%. With a current dividend per share of $1.67 and a solid dividend history spanning 8 years, the company has remained committed to returning value to its shareholders. Notably, there has been no dividend cut or suspension recently, underscoring the company's stable payout strategy.
| Category | Detail |
|---|---|
| Sector | Real Estate |
| Dividend yield | 5.44% |
| Current dividend per share | 1.67 USD |
| Dividend history | 8 years |
| Last cut or suspension | None |
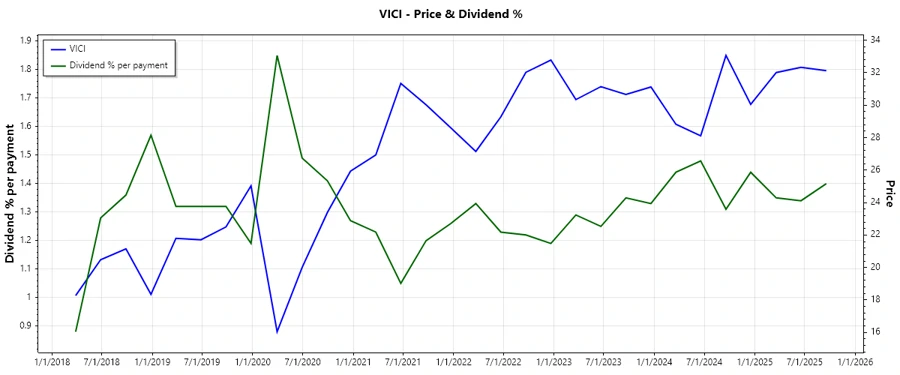
🗣️ Dividend History
VICI Properties has been a reliable dividend payer, with consistent increases over the years. Such a history is crucial for assessing the long-term return potential of a stock, providing insights into management’s commitment to shareholder returns.
| Year | Dividend per Share (USD) |
|---|---|
| 2025 | 1.3150 |
| 2024 | 1.6950 |
| 2023 | 1.6100 |
| 2022 | 1.5000 |
| 2021 | 1.3800 |
📈 Dividend Growth
Understanding dividend growth helps assess future income streams. VICI's dividend growth rate shows steady increases, aiding in wealth accumulation over the long term.
| Time | Growth |
|---|---|
| 3 years | 7.09% |
| 5 years | 7.70% |
The average dividend growth is 7.70% over 5 years. This shows moderate but steady dividend growth.
⚠️ Payout Ratio
The payout ratio is critical for evaluating the sustainability of dividend payments. VICI's payout ratios suggest a balanced approach, maintaining enough earnings for reinvestment and growth while rewarding shareholders.
| Key Figure | Ratio |
|---|---|
| EPS-based | 64.17% |
| Free cash flow-based | 72.73% |
The EPS payout is manageable, supporting dividend sustainability. Similarly, the FCF payout shows the company's capability to sustain dividends from cash operations.
✅ Cashflow & Capital Efficiency
VICI's cashflow and capital efficiency metrics like free cash flow yield and earnings yield indicate strong internal cash generation, essential for business operations and dividend payments. These metrics highlight VICI's financial health.
| Metric | 2024 | 2023 | 2022 |
|---|---|---|---|
| Free Cash Flow Yield | 7.76% | 6.73% | 6.83% |
| Earnings Yield | 8.76% | 7.77% | 3.93% |
| CAPEX to Operating Cash Flow | 0.04% | 0.18% | 0.10% |
| Stock-based Compensation to Revenue | 0.45% | 0.43% | 0.50% |
| Free Cash Flow / Operating Cash Flow | 99.68% | 99.81% | 99.90% |
VICI exhibits efficient cash usage with high free cash flow and operating cash flow conversion rates, fortifying its dividend strategy and operational investments.
🔍 Balance Sheet & Leverage Analysis
Investigating financial leverage and liquidity risk sheds light on financial resilience and obligation management.
| Metric | 2024 | 2023 | 2022 |
|---|---|---|---|
| Debt-to-Equity | 66.51% | 69.80% | 66.42% |
| Debt-to-Assets | 38.90% | 40.01% | 38.77% |
| Debt-to-Capital | 39.94% | 41.11% | 39.91% |
| Net Debt to EBITDA | 4.81 | 5.07 | 8.54 |
| Current Ratio | 2.78 | 28.22 | 28.97 |
| Quick Ratio | 27.92 | 28.22 | 28.97 |
| Financial Leverage | 1.71 | 1.74 | 1.71 |
VICI's comprehensive balance sheet management ensures adequate asset support for liabilities, presenting a stable debt profile.
✨ Fundamental Strength & Profitability
These profitability metrics signify VICI's efficiency in utilizing its assets and equities to generate profits.
| Metric | 2024 | 2023 | 2022 |
|---|---|---|---|
| Return on Equity | 10.09% | 9.95% | 5.10% |
| Return on Assets | 5.90% | 5.70% | 2.97% |
| Margins: Net | 69.59% | 69.59% | 42.97% |
| Margins: EBIT | 92.41% | 93.20% | 64.56% |
| Margins: EBITDA | 92.52% | 93.32% | 64.69% |
| Margins: Gross | 99.30% | 99.25% | 99.13% |
| Research & Development to Revenue | 0% | 0% | 0% |
VICI's high margins and strong returns indicate effective management and robust profitability.
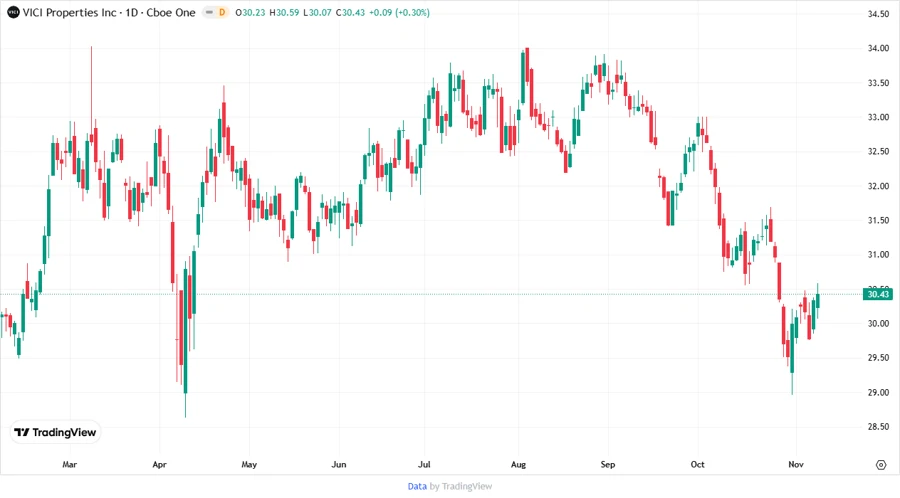
🏷️ Price Development
📊 Dividend Scoring System
| Category | Score | Score Description |
|---|---|---|
| Dividend yield | 4 | |
| Dividend Stability | 5 | |
| Dividend Growth | 4 | |
| Payout ratio | 4 | |
| Financial stability | 5 | |
| Dividend continuity | 5 | |
| Cashflow Coverage | 5 | |
| Balance Sheet Quality | 5 |
Overall Score: 37/40
🔵 Rating
VICI Properties Inc. showcases a compelling dividend profile backed by consistent growth, substantial yield, and sturdy financial metrics. With a high dividend score, it appeals to income-focused investors and holds promise for sustainable income and potential appreciation. We recommend VICI Properties as a robust addition to dividend and income investment portfolios.