July 08, 2025 a 02:46 am


VICI: Dividend Analysis - VICI Properties Inc.
VICI Properties Inc., with its robust market presence and consistent dividend distribution, presents a compelling profile for dividend-focused investors. Despite challenging market conditions, VICI has maintained a steady stream of dividends, reflecting its commitment to shareholder value. The company's market capitalization and strategic real estate holdings provide a solid foundation, bolstering its ability to generate income and ensure dividend sustainability.
Overview 📊
VICI Properties Inc. operates within the real estate sector, offering investors a lucrative dividend yield of 6.63%. With a current dividend per share of 1.67 USD and an 8-year dividend history, VICI showcases strong stability in its dividend payments. The absence of recent dividend cuts suggests resilience in its cash flow management.
| Sector | Dividend Yield (%) | Current Dividend Per Share (USD) | Dividend History (Years) | Last Cut or Suspension |
|---|---|---|---|---|
| Real Estate | 6.63 | 1.67 | 8 | None |
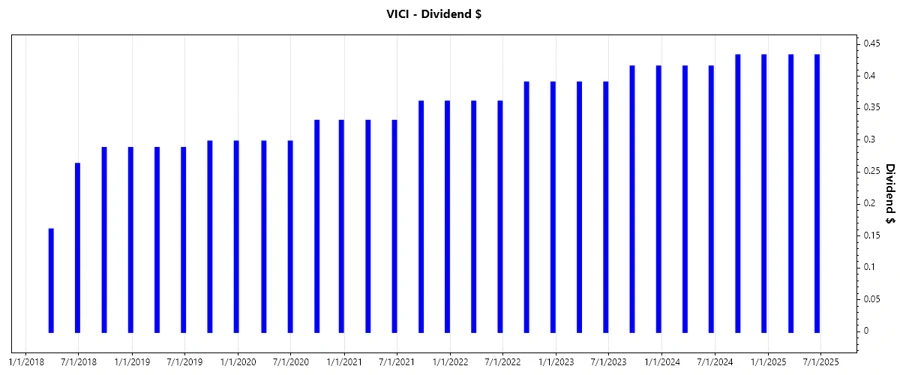
Dividend History 🗣️
VICI's consistent dividend payments over the last five years highlight its financial stability and shareholder commitment. Investors value stability in dividend history as it reflects predictable income streams.
| Year | Dividend Per Share (USD) |
|---|---|
| 2025 | 0.87 |
| 2024 | 1.70 |
| 2023 | 1.61 |
| 2022 | 1.50 |
| 2021 | 1.38 |
Dividend Growth 📈
VICI's dividend growth is indicative of its strategic approach to enhancing shareholder value over time. Steady growth over both 3-year (7.09%) and 5-year (7.70%) horizons underscores financial robustness.
| Time | Growth (%) |
|---|---|
| 3 years | 7.09 |
| 5 years | 7.70 |
The average dividend growth is 7.70% over 5 years. This shows moderate but steady dividend growth.
Payout Ratio 📉
The payout ratio is crucial for assessing the sustainability of dividends. VICI boasts an EPS-based payout ratio of 67.18% and a free cash flow-based payout ratio of 72.91%, reflecting a balanced approach between rewarding shareholders and reinvesting in the business.
| Key Figure | Ratio (%) |
|---|---|
| EPS-based | 67.18 |
| Free cash flow-based | 72.91 |
A payout ratio using EPS of 67.18% and FCF of 72.91% demonstrates a conservative approach, maintaining adequate capital for business growth while providing returns to investors.
Cashflow & Capital Efficiency ✅
Robust cash flow metrics signal VICI's efficient capital management. The Free Cash Flow Yield and Earnings Yield are pivotal for understanding the company's profitability and cash generation efficiency.
| Metric | 2024 | 2023 | 2022 |
|---|---|---|---|
| Free Cash Flow Yield | 7.76% | 6.73% | 6.83% |
| Earnings Yield | 8.76% | 7.77% | 3.93% |
| CAPEX to Operating Cash Flow | 0.00% | 0.19% | 0.10% |
| Stock-based Compensation to Revenue | 0.46% | 0.43% | 0.50% |
| Free Cash Flow / Operating Cash Flow Ratio | 0.997 | 0.998 | 0.999 |
These metrics suggest efficient cash flow management and a solid approach to capital investment strategy, vital for sustaining growth and value creation.
Balance Sheet & Leverage Analysis ⚠️
VICI's balance sheet metrics such as the Debt-to-Equity and Debt-to-Assets ratios provide insights into its leverage and financial structure, with implications on stability and risk.
| Metric | 2024 | 2023 | 2022 |
|---|---|---|---|
| Debt-to-Equity | 0.665 | 0.698 | 0.664 |
| Debt-to-Assets | 0.389 | 0.400 | 0.388 |
| Debt-to-Capital | 0.399 | 0.411 | 0.399 |
| Net Debt to EBITDA | 4.83 | 5.07 | 8.42 |
| Current Ratio | - | 28.22 | 28.97 |
| Quick Ratio | 27.92 | 28.22 | 28.97 |
The leverage ratios indicate a well-managed debt structure, enhancing the firm's financial flexibility and resilience against market fluctuations.
Fundamental Strength & Profitability 📊
Key profitability metrics like Return on Equity and Margins offer insights into VICI's operational efficiency and strategic competitiveness in the market.
| Metric | 2024 | 2023 | 2022 |
|---|---|---|---|
| Return on Equity | 10.09% | 9.95% | 5.10% |
| Return on Assets | 5.90% | 5.70% | 2.97% |
| Net Margin | 69.59% | 69.59% | 42.97% |
| EBIT Margin | 92.41% | 93.20% | 64.56% |
| EBITDA Margin | 92.08% | 93.32% | 65.56% |
| Gross Margin | 99.30% | 99.25% | 96.84% |
| R&D to Revenue | 0% | 0% | 0% |
Overall, these metrics affirm VICI's strong market positioning, operational effectiveness, and ability to maintain competitive profitability margins.
Price Development
Dividend Scoring System 📊
| Category | Score | Bar |
|---|---|---|
| Dividend Yield | 4 | |
| Dividend Stability | 5 | |
| Dividend Growth | 3 | |
| Payout Ratio | 4 | |
| Financial Stability | 4 | |
| Dividend Continuity | 5 | |
| Cashflow Coverage | 5 | |
| Balance Sheet Quality | 4 |
Overall Score: 34/40
Rating 🏆
VICI Properties Inc presents a compelling dividend profile with stable and attractive yield metrics, making it suitable for income-oriented investors. Its consistent growth and prudent financial management underscore its potential as a reliable investment for long-term value appreciation.
Smart Data Insight
Master the Perfect Entry & Exit for this Stock
Don't leave your profits to chance. Historically, this stock follows specific seasonal patterns that institutional traders use to maximize returns.
- ✅ Identify the "Golden Buying Window"
- ✅ Avoid high-risk correction cycles
- ✅ Backtested data from the last 20+ years