
May 30, 2026 a 04:44 pm
VEEV: Fibonacci Analysis - Veeva Systems Inc.
Veeva Systems Inc., a leader in cloud-based software for the life sciences industry, has experienced a significant downtrend in recent months. As the company continues to innovate, its stock performance has come under scrutiny. Analyzing the latest trend can provide insights into possible future movements, making it crucial for investors to understand the key levels. Understanding Fibonacci retracement levels can aid in identifying potential support and resistance areas.
Fibonacci Analysis
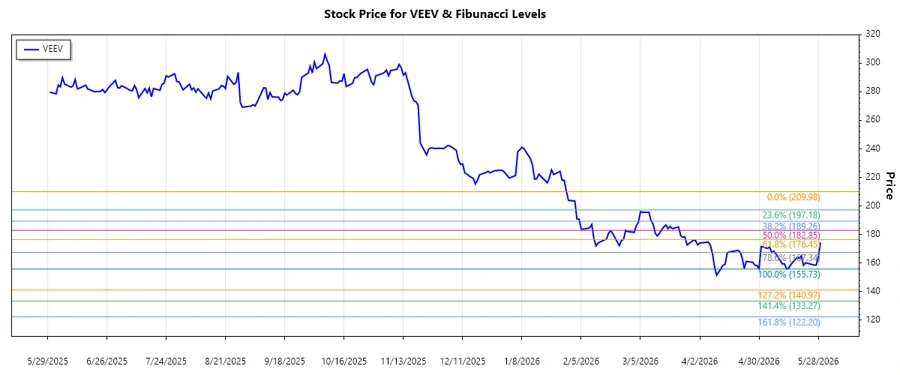
Analyzing the historical data for Veeva Systems Inc. (VEEV), a clear downtrend is visible from February 2, 2026, to May 29, 2026. The stock price saw a high of $209.98 on January 29, 2026, and a subsequent low of $155.73 on May 13, 2026. Using these points, the Fibonacci retracement levels can be calculated to offer guidance on potential support and resistance levels.
| Parameters | Details |
|---|---|
| Trend Start Date | 2026-02-02 |
| Trend End Date | 2026-05-29 |
| High Point (Date) | 2026-01-29 |
| High Point (Price) | $209.98 |
| Low Point (Date) | 2026-05-13 |
| Low Point (Price) | $155.73 |
Fibonacci Retracement Levels
| Level | Price |
|---|---|
| 0.236 | $168.06 |
| 0.382 | $176.95 |
| 0.5 | $182.85 |
| 0.618 | $188.76 |
| 0.786 | $196.14 |
Current technical analysis indicates the price remains around the lower Fibonacci levels, suggesting that the current price is near the 0.236 retracement area. This positions the stock at a potential support level, which could signify the beginning of a reversal if the price holds. Should this level break, further downside may be anticipated.
Conclusion
Veeva Systems Inc.'s stock currently demonstrates potential for recovery as it approaches a crucial Fibonacci level. The company's strong foundation in cloud-based solutions for the life sciences sector underpins confidence among analysts. However, caution prevails due to ongoing volatility and uncertainty in the broader market. Monitoring upcoming price movements concerning the 0.236 and subsequent retracement levels could provide further clarity. BREaking above higher Fibonacci levels might signal a bullish reversal, but persistence below could entail further decline. Overall, analysts should remain vigilant for new developments while considering strategic positions.
Smart Data Insight
Master the Perfect Entry & Exit for this Stock
Don't leave your profits to chance. Historically, this stock follows specific seasonal patterns that institutional traders use to maximize returns.
- ✅ Identify the "Golden Buying Window"
- ✅ Avoid high-risk correction cycles
- ✅ Backtested data from the last 20+ years