May 12, 2026 a 10:15 am
VEEV: Fibonacci Analysis - Veeva Systems Inc.
Veeva Systems Inc., a leader in cloud-based software for the life sciences industry, has recently seen fluctuations in its stock price. In the last few months, the company's stock faced a steep decline, indicative of prevailing concerns in the market. Considering its strong business model and focus on innovation, Veeva has potential upside if market conditions improve. The latest analysis focuses on the stock's recent technical movements, with a detailed Fibonacci retracement analysis providing insight into future price action.
Fibonacci Analysis
| Highlight | Information |
|---|---|
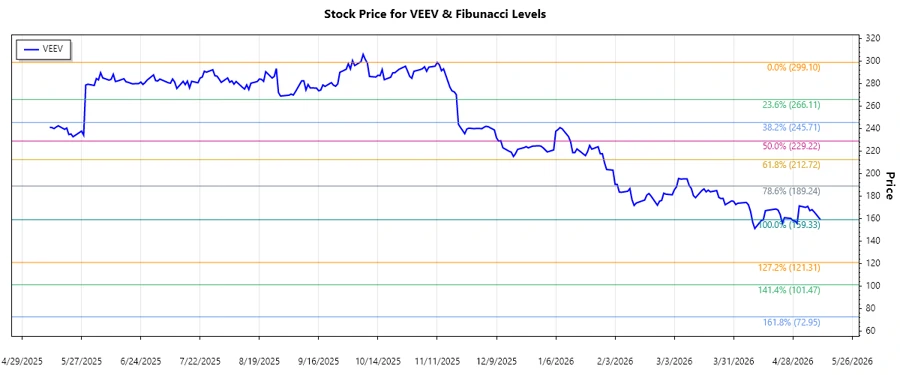
| Trend Period | From 2025-11-11 to 2026-05-11 |
| High | $299.10 on 2025-11-11 |
| Low | $159.33 on 2026-05-11 |
Fibonacci Levels
| Level | Price |
|---|---|
| 0.236 | $192.70 |
| 0.382 | $213.01 |
| 0.5 | $229.21 |
| 0.618 | $245.41 |
| 0.786 | $268.21 |
The current price at $159.33 is below all standard Fibonacci retracement levels, indicating that it is not in a standard retracement area. The technical implication is that there might be further downside unless price actions convincingly break back up through these levels.
Conclusion
The recent downtrend in Veeva Systems Inc.'s stock has pushed prices below significant Fibonacci retracement levels, indicating potential continued weakness unless reversal patterns emerge. While broader market conditions and investor sentiment have impacted the stock, Veeva’s strong product portfolio and continued demand for cloud-based services in the life sciences sector offer a fundamental upside. Investors should monitor upcoming market conditions and company announcements closely to anticipate potential recovery signals. Analysts might consider this an opportunity to assess long-term positions if signs of stabilization or reversal appear in the near future.
Smart Data Insight
Master the Perfect Entry & Exit for this Stock
Don't leave your profits to chance. Historically, this stock follows specific seasonal patterns that institutional traders use to maximize returns.
- ✅ Identify the "Golden Buying Window"
- ✅ Avoid high-risk correction cycles
- ✅ Backtested data from the last 20+ years