April 28, 2026 a 03:16 pm


Utility Stocks - Performance Analysis
📊 The utility sector has exhibited varied performance across different time frames, with notable trends observed over the past weeks and months. This analysis delves into the performance of key utility stocks, highlighting both top performers and underperformers. Such analysis is crucial for investors seeking to make informed decisions in a sector known for stability and dividends.
Utility Stocks Performance One Week
| Stock | Performance (%) | Performance |
|---|---|---|
| CEG | 12.97 | |
| NEE | 4.80 | |
| AEP | 2.42 | |
| D | 2.32 | |
| PEG | 2.10 | |
| SO | 2.02 | |
| DUK | 1.16 | |
| EXC | 0.71 | |
| SRE | -0.72 |
Utility Stocks Performance One Month
| Stock | Performance (%) | Performance |
|---|---|---|
| CEG | 5.30 | |
| NEE | 3.97 | |
| AEP | 3.85 | |
| D | 2.77 | |
| PEG | -0.45 | |
| SO | -1.80 | |
| SRE | -3.50 | |
| DUK | -2.16 | |
| EXC | -3.56 |
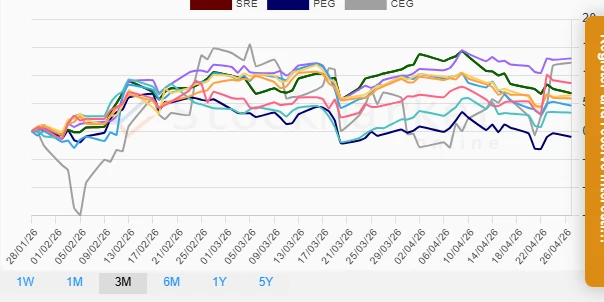
Utility Stocks Performance Three Months
| Stock | Performance (%) | Performance |
|---|---|---|
| AEP | 12.98 | |
| CEG | 12.21 | |
| SRE | 6.78 | |
| SO | 6.43 | |
| DUK | 5.84 | |
| EXC | 4.57 | |
| NEE | 8.58 | |
| D | 3.31 | |
| PEG | -1.00 |
Summary
✅ The utility sector has shown robust performance in the three-month period, with AEP and CEG leading as top performers. Despite a challenging one-month period, with several stocks in the red, the overall trajectory over three months is positive. CEG, NEE, and AEP have consistently outperformed, suggesting strong operational metrics and market sentiment. Investment in these top-tier utility stocks appears promising, while vigilance towards underperformers is advised.
Smart Data Insight
Master the Perfect Entry & Exit for this Stock
Don't leave your profits to chance. Historically, this stock follows specific seasonal patterns that institutional traders use to maximize returns.
- ✅ Identify the "Golden Buying Window"
- ✅ Avoid high-risk correction cycles
- ✅ Backtested data from the last 20+ years