
January 27, 2026 a 03:16 pm


Utility Stocks - Performance Analysis
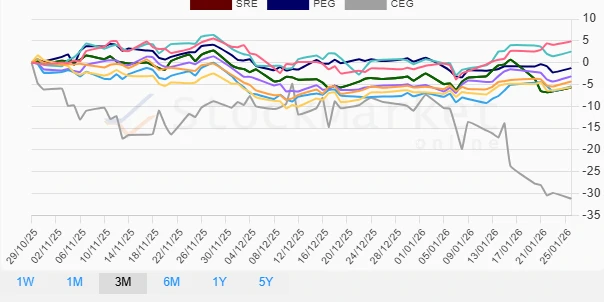
The utility sector has shown varied performance over recent weeks and months, with significant fluctuations attributable to market conditions, regulatory changes, and company-specific events. This analysis offers insights into the top-performing and underperforming stocks within the sector, assessing short-term and medium-term trends.
Utility Stocks Performance One Week 📊
| Stock | Performance (%) | Performance |
|---|---|---|
| NEE | 2.33% | |
| PEG | -0.39% | |
| DUK | -0.63% | |
| SO | -0.73% | |
| EXC | -0.88% | |
| AEP | -0.99% | |
| D | -1.39% | |
| SRE | -1.94% | |
| CEG | -3.44% |
Utility Stocks Performance One Month 📈
| Stock | Performance (%) | Performance |
|---|---|---|
| NEE | 6.23% | |
| D | 1.84% | |
| EXC | 2.32% | |
| AEP | 2.10% | |
| DUK | 1.41% | |
| SO | 1.17% | |
| PEG | -1.61% | |
| SRE | -1.93% | |
| CEG | -22.14% |
Utility Stocks Performance Three Months ➡️
| Stock | Performance (%) | Performance |
|---|---|---|
| D | 2.53% | |
| NEE | 4.87% | |
| PEG | -1.26% | |
| AEP | -3.14% | |
| DUK | -4.33% | |
| EXC | -5.46% | |
| SO | -5.64% | |
| SRE | -5.70% | |
| CEG | -31.15% |
Summary ✅
The utility sector demonstrates significant volatility, with NEE showing consistent positive performance across all time frames. CEG emerges as the largest underperformer, consistently declining sharply, possibly due to external pressures or internal challenges. Monitoring sector-specific indices and economic indicators would be prudent to assess future opportunities or risks. Investors should consider a diversified approach, balancing high-performers with corrective measures for struggling assets.
Smart Data Insight
Master the Perfect Entry & Exit for this Stock
Don't leave your profits to chance. Historically, this stock follows specific seasonal patterns that institutional traders use to maximize returns.
- ✅ Identify the "Golden Buying Window"
- ✅ Avoid high-risk correction cycles
- ✅ Backtested data from the last 20+ years