August 26, 2025 a 03:16 pm


Utility Stocks - Performance Analysis
The utilities sector has exhibited diverse performance patterns over recent time frames. This analysis delves into the intricacies of sector movements, highlighting significant gains and losses over varying periods. Traders should consider these dynamics when strategizing their investments.
📊 Utility Stocks Performance One Week
| Stock | Performance (%) | Performance |
|---|---|---|
| AEP | 0.32 | |
| EXC | -0.30 | |
| DUK | -0.53 | |
| SO | -1.11 | |
| SRE | -1.12 | |
| NEE | -1.55 | |
| D | -1.78 | |
| CEG | -2.09 | |
| PEG | -2.35 |
📊 Utility Stocks Performance One Month
| Stock | Performance (%) | Performance |
|---|---|---|
| NEE | 4.92 | |
| AEP | 3.05 | |
| DUK | 2.75 | |
| D | 2.58 | |
| EXC | 1.52 | |
| SRE | 1.24 | |
| SO | -2.30 | |
| CEG | -4.84 | |
| PEG | -5.67 |
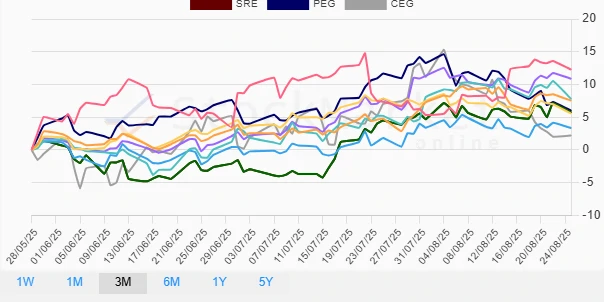
📊 Utility Stocks Performance Three Months
| Stock | Performance (%) | Performance |
|---|---|---|
| NEE | 12.27 | |
| AEP | 10.88 | |
| D | 7.78 | |
| DUK | 7.53 | |
| PEG | 6.01 | |
| SRE | 5.72 | |
| SO | 5.55 | |
| EXC | 3.34 | |
| CEG | 2.19 |
🔍 Summary
In reviewing the utilities sector, notable discrepancies in stock performances over varying time frames are apparent. NEE has consistently demonstrated robust gains, especially over a three-month period. AEP has also shown resilience, while PEG and CEG often appear as underperformers. Investors should consider these trends when assessing potential entry points and long-term hold stocks.
Smart Data Insight
Master the Perfect Entry & Exit for this Stock
Don't leave your profits to chance. Historically, this stock follows specific seasonal patterns that institutional traders use to maximize returns.
- ✅ Identify the "Golden Buying Window"
- ✅ Avoid high-risk correction cycles
- ✅ Backtested data from the last 20+ years