
September 22, 2026 a 03:16 pm


Utility Stocks - Performance Analysis
The utility sector has been historically known for providing steady returns. However, recent market conditions have induced volatility, affecting their performance. This analysis reviews the performance of major utility stocks over three key periods: one week, one month, and three months, to identify the trends and provide insights for investors.
Utility Stocks Performance One Week (1W) 📊
Within a short span of one week, utility stocks depicted a mixed performance, with some stocks showing resilience while others declined. CEG stood out as a top gainer with a 0.95% increase, whereas NEE suffered a notable decline at -1.77%. The majority of stocks experienced slight to moderate decreases, reflecting a cautious market sentiment.
| Stock | Performance (%) | Performance |
|---|---|---|
| CEG | 0.95% | |
| SRE | 0.01% | |
| AEP | -0.46% | |
| EXC | -0.51% | |
| SO | -0.56% | |
| DUK | -0.87% | |
| PEG | -1.56% | |
| D | -1.63% | |
| NEE | -1.77% |
Utility Stocks Performance One Month (1M) 📆
Over one month, a continuous decline is noted across the board, with D seeing the most significant drop of -5.75%. The broad weakness in these equities may suggest sectoral headwinds and external macroeconomic factors influencing utilities more broadly. Strategic positioning will be key to navigating these trends.
| Stock | Performance (%) | Performance |
|---|---|---|
| AEP | -0.70% | |
| SRE | -1.88% | |
| DUK | -2.56% | |
| CEG | -3.35% | |
| SO | -3.94% | |
| NEE | -4.85% | |
| PEG | -4.57% | |
| EXC | -4.14% | |
| D | -5.75% |
Utility Stocks Performance Three Months (3M) 📉
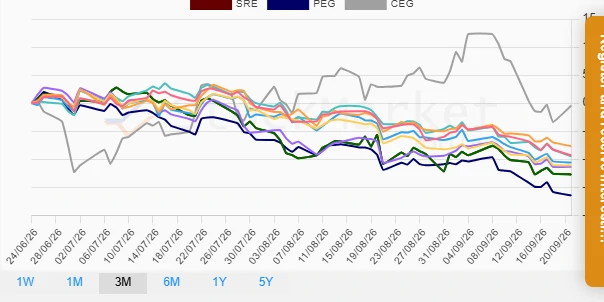
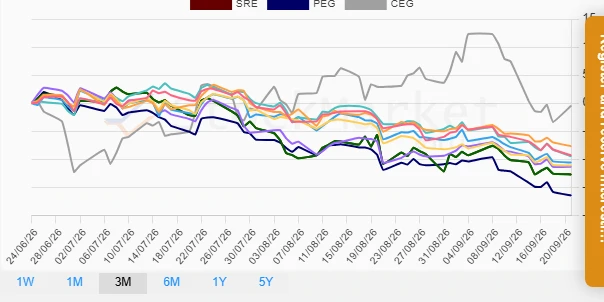
The three-month perspective presents even deeper contractions, with PEG leading the declines at -16.45%. The broader market dynamics, coupled with specific industry challenges, could be exacerbating this downtrend. This trend suggests an urgent need for diversification and defensive strategies for investors heavily reliant on utility stocks.
| Stock | Performance (%) | Performance |
|---|---|---|
| CEG | -0.45% | |
| DUK | -7.66% | |
| NEE | -9.30% | |
| D | -9.47% | |
| EXC | -10.59% | |
| SO | -11.10% | |
| AEP | -11.31% | |
| SRE | -12.69% | |
| PEG | -16.45% |
Summary ✅
The analysis of utility stocks over one week, one month, and three months reveals a sector under pressure, likely due to economic factors and evolving industry conditions. The persistent declines, particularly in the three-month view, highlight the potential necessity for sectoral reassessment. Investors may wish to consider diversifying portfolios and positioning for defensiveness in the near term while keeping an eye on potential recovery signals within the sector.
Smart Data Insight
Master the Perfect Entry & Exit for this Stock
Don't leave your profits to chance. Historically, this stock follows specific seasonal patterns that institutional traders use to maximize returns.
- ✅ Identify the "Golden Buying Window"
- ✅ Avoid high-risk correction cycles
- ✅ Backtested data from the last 20+ years