July 22, 2025 a 03:16 pm


Utility Stocks - Performance Analysis 🔍
The utility sector has shown varied performance levels over different time frames, reflecting a combination of market dynamics and sector-specific factors. Short-term, medium-term, and longer-term performances showcase how different stocks within the sector reacted under prevailing market conditions. Understanding these trends is crucial for making informed investment decisions.
Utility Stocks Performance One Week 📊
| Stock | Performance (%) | Performance |
|---|---|---|
| SRE | 5.86 | |
| AEP | 3.91 | |
| PEG | 3.11 | |
| SO | 2.49 | |
| DUK | 2.32 | |
| D | 2.01 | |
| NEE | 1.95 | |
| EXC | 1.81 | |
| CEG | 0.11 |
Utility Stocks Performance One Month 📊
| Stock | Performance (%) | Performance |
|---|---|---|
| NEE | 6.57 | |
| D | 6.35 | |
| SRE | 6.04 | |
| SO | 5.99 | |
| CEG | 4.66 | |
| DUK | 3.82 | |
| AEP | 6.56 | |
| PEG | 2.87 | |
| EXC | 2.70 |
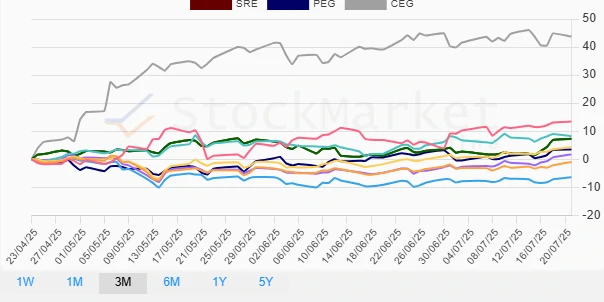
Utility Stocks Performance Three Months 📊
| Stock | Performance (%) | Performance |
|---|---|---|
| CEG | 43.77 | |
| NEE | 13.44 | |
| D | 8.29 | |
| SRE | 7.32 | |
| SO | 4.27 | |
| PEG | 3.53 | |
| AEP | 1.75 | |
| DUK | -0.98 | |
| EXC | -6.40 |
Summary 🗣️
The utility sector displayed disparate performance across the different time horizons. Over the short term of one week and one month, the sector's stocks generally had positive trends, with SRE and NEE being standout performers. However, in the three-month span, while CEG exhibited exceptional gains, DUK and EXC faced challenges, reflecting sector volatility. Investors should consider both short-term gains and potential long-term risks, ensuring a balanced approach in their portfolios.
Smart Data Insight
Master the Perfect Entry & Exit for this Stock
Don't leave your profits to chance. Historically, this stock follows specific seasonal patterns that institutional traders use to maximize returns.
- ✅ Identify the "Golden Buying Window"
- ✅ Avoid high-risk correction cycles
- ✅ Backtested data from the last 20+ years