October 21, 2025 a 03:17 pm


Utility Stocks - Performance Analysis
The utilities sector has showcased a dynamic range of performances over the recent periods. This analysis delves into the weekly, monthly, and quarterly transformations of major utility stocks, providing insights into outperformers and laggards. Our evaluation highlights significant trends and patterns that have emerged, likely influenced by macroeconomic factors and market sentiment. Let us dissect the data and understand the broader implications for investors within this sector.
Utility Stocks Performance One Week 📊
| Stock | Performance (%) | Performance |
|---|---|---|
| PEG | 2.90 | |
| EXC | 1.82 | |
| SRE | 1.53 | |
| DUK | 0.88 | |
| NEE | 0.17 | |
| D | -0.08 | |
| AEP | -0.46 | |
| SO | -2.00 | |
| CEG | -4.95 |
Utility Stocks Performance One Month 📊
| Stock | Performance (%) | Performance |
|---|---|---|
| CEG | 12.15 | |
| SRE | 11.11 | |
| EXC | 10.66 | |
| AEP | 9.69 | |
| DUK | 6.36 | |
| SO | 6.33 | |
| NEE | 17.87 | |
| PEG | 4.03 | |
| D | 2.77 |
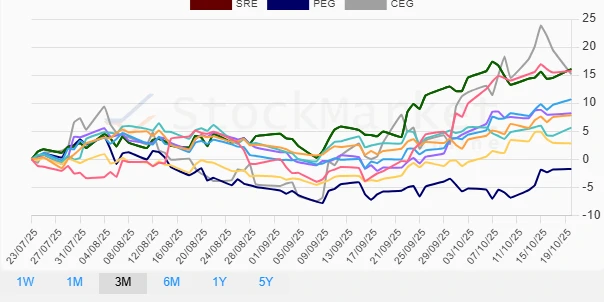
Utility Stocks Performance Three Months 📊
| Stock | Performance (%) | Performance |
|---|---|---|
| SRE | 16.08 | |
| CEG | 15.18 | |
| NEE | 15.75 | |
| EXC | 10.67 | |
| AEP | 8.21 | |
| DUK | 7.83 | |
| D | 5.64 | |
| SO | 2.83 | |
| PEG | -1.73 |
Summary 🗣️
Over the short and medium terms, utility stocks have displayed varied performance profiles. In the one-week timeframe, PEG, EXC, and SRE led the upside, while CEG significantly lagged. Over one month, CEG and SRE showcased strong growth, with EXC also performing notably. The three-month perspective reiterated dominance by SRE and close performances by NEE and CEG. Notably, PEG presented as an underperformer in the quarterly horizon. These movements suggest sector-specific influences and should be monitored for a better grasp on volatility and cyclical trends, offering investment prospects for both conservative and opportunistic portfolios.
Smart Data Insight
Master the Perfect Entry & Exit for this Stock
Don't leave your profits to chance. Historically, this stock follows specific seasonal patterns that institutional traders use to maximize returns.
- ✅ Identify the "Golden Buying Window"
- ✅ Avoid high-risk correction cycles
- ✅ Backtested data from the last 20+ years