May 20, 2025 a 03:16 pm


Utility Stocks - Performance Analysis
📊 In this analysis, we delve into the performance of the leading utility sector stocks over three distinct periods: one week, one month, and three months. The utilities sector, known for its defensive characteristics, presents interesting trends that have emerged in recent months. This report aims to highlight top performers, identify underperformers, and draw insights from the fluctuating market conditions impacting these stocks.
Utility Stocks Performance One Week
| Stock | Performance (%) | Performance |
|---|---|---|
| SO | 4.53 | |
| AEP | 4.22 | |
| D | 4.38 | |
| SRE | 4.34 | |
| DUK | 3.46 | |
| EXC | 3.31 | |
| PEG | 2.79 | |
| NEE | 2.46 | |
| CEG | 0.90 |
Utility Stocks Performance One Month
| Stock | Performance (%) | Performance |
|---|---|---|
| CEG | 36.84 | |
| NEE | 11.10 | |
| SRE | 9.92 | |
| D | 5.67 | |
| AEP | -3.47 | |
| DUK | -3.79 | |
| PEG | -4.20 | |
| SO | -2.36 | |
| EXC | -6.01 |
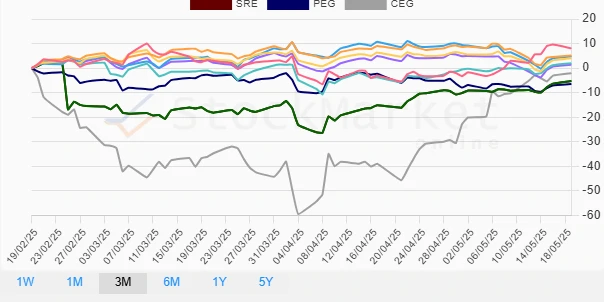
Utility Stocks Performance Three Months
| Stock | Performance (%) | Performance |
|---|---|---|
| NEE | 8.07 | |
| DUK | 5.18 | |
| EXC | 4.73 | |
| SO | 4.02 | |
| D | 1.95 | |
| AEP | 1.41 | |
| CEG | -2.07 | |
| SRE | -5.26 | |
| PEG | -6.48 |
Summary
📈 The performance of utility stocks presents a mosaic of trends, with some stocks exhibiting resilience across multiple timeframes and others showing volatility. During the one-week period, all stocks showed positive returns, whereas the one-month analysis revealed significant divergences, with CEG performing exceedingly well. The three-month analysis portrays NEE as a consistent outperformer, while PEG has experienced continuous struggles. These insights underscore the importance of a nuanced approach when investing in the utility sector, as external economic factors and individual company strategies greatly influence performance.
Smart Data Insight
Master the Perfect Entry & Exit for this Stock
Don't leave your profits to chance. Historically, this stock follows specific seasonal patterns that institutional traders use to maximize returns.
- ✅ Identify the "Golden Buying Window"
- ✅ Avoid high-risk correction cycles
- ✅ Backtested data from the last 20+ years