November 18, 2025 a 03:17 pm


Utility Stocks - Performance Analysis
The utility sector has showcased a range of performances in recent times, with distinct movements across different timeframes. By analyzing these periods, we gain a clearer insight into the strengths and weaknesses of major utility stocks, helping investors make more informed decisions. 📊
Utility Stocks Performance One Week
The one-week performance reveals EXC as the top performer with a 2.55% increase, highlighting its robust short-term resilience. In contrast, CEG faced the strongest headwinds, dropping by 3.62%, suggesting potential market concerns or unfavorable conditions. This mixed performance within the utilities sector underlines the diverse responses to market dynamics and individual stock catalysts.
| Stock | Performance (%) | Performance |
|---|---|---|
| EXC | 2.55% | |
| DUK | 1.24% | |
| AEP | 0.83% | |
| D | 0.51% | |
| NEE | 0.04% | |
| SO | -0.61% | |
| SRE | -1.42% | |
| PEG | -1.52% | |
| CEG | -3.62% |
Utility Stocks Performance One Month
Over the one-month period, AEP distinguished itself as the leader with a gain of 5.38%, a testament to its recent strategic shifts or market acceptance. Conversely, CEG experienced the most significant decline at -12.18%, potentially due to external pressures or internal challenges. This duration highlights the fluctuating nature of utility stock performance and the importance of strategic positioning.
| Stock | Performance (%) | Performance |
|---|---|---|
| AEP | 5.38% | |
| D | 1.65% | |
| NEE | 1.62% | |
| SRE | 1.04% | |
| EXC | -2.42% | |
| DUK | -2.56% | |
| PEG | -2.56% | |
| SO | -7.59% | |
| CEG | -12.18% |
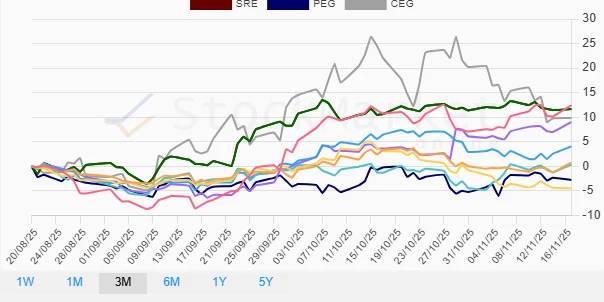
Utility Stocks Performance Three Months
Analyzing a three-month horizon, NEE emerges as the standout performer with a 12.39% uplift—a significant positive trajectory reflecting strong market confidence or successful strategic execution. Meanwhile, SO's decline of -4.49% raises questions around its longer-term positioning or strategic challenges. The performance over this duration signifies the varied strategic effectiveness and market positioning of utility companies.
| Stock | Performance (%) | Performance |
|---|---|---|
| NEE | 12.39% | |
| SRE | 11.68% | |
| CEG | 9.84% | |
| AEP | 9.00% | |
| EXC | 4.02% | |
| DUK | 0.75% | |
| D | 0.34% | |
| PEG | -2.78% | |
| SO | -4.49% |
Summary
📈 The utility stocks performance analysis over the designated periods reveals the dynamic nature of the sector. NEE consistently illustrated robust performance, particularly over the three-month span, underscoring its commendable strategic initiatives or market positioning. Conversely, CEG and SO frequently occupied the lower ranks, indicating potential challenges or market pressures they may face. Investors should closely monitor these trends, leveraging the insights for strategic portfolio adjustments and risk management. The cyclical and sometimes volatile nature of the utility sector necessitates diligent analysis and strategic foresight to capitalize on prevailing opportunities and mitigate risks. 💡
Smart Data Insight
Master the Perfect Entry & Exit for this Stock
Don't leave your profits to chance. Historically, this stock follows specific seasonal patterns that institutional traders use to maximize returns.
- ✅ Identify the "Golden Buying Window"
- ✅ Avoid high-risk correction cycles
- ✅ Backtested data from the last 20+ years