
August 18, 2026 a 03:16 pm


Utility Stocks - Performance Analysis
This report provides a detailed examination of the recent performance of major utility stocks over different time horizons. Understanding these trends is crucial for making informed investment decisions in the utilities sector. This comprehensive analysis highlights trends, identifies top performers, and pinpoints stocks that may require further examination.
Utility Stocks Performance One Week 📊
This week saw positive momentum for most utility stocks, with several outperformers, notably AEP and EXC, achieving significant gains. This indicates a potential positive shift in investor sentiment towards the utility sector.
| Stock | Performance (%) | Performance |
|---|---|---|
| EXC | 1.56% | |
| AEP | 2.38% | |
| D | 0.98% | |
| NEE | 0.56% | |
| SRE | 0.54% | |
| PEG | 0.53% | |
| SO | 0.40% | |
| DUK | 0.32% | |
| CEG | -0.03% |
Utility Stocks Performance One Month 📊
The one-month period has been challenging, with many utility stocks recording losses, except for CEG, which stands out as a significant outperformer with a gain of 10.26%. This suggests potential for targeted investment strategies.
| Stock | Performance (%) | Performance |
|---|---|---|
| CEG | 10.26% | |
| DUK | -1.03% | |
| EXC | -1.34% | |
| NEE | -2.87% | |
| SO | -3.13% | |
| PEG | -3.83% | |
| D | -3.15% | |
| AEP | -4.18% | |
| SRE | -6.93% |
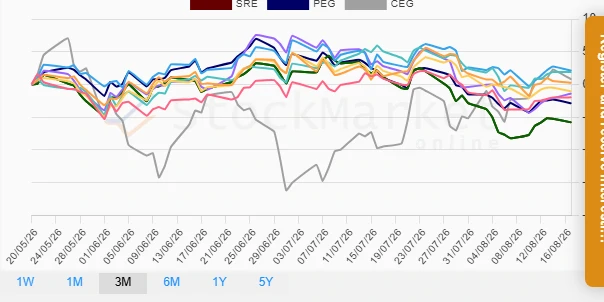
Utility Stocks Performance Three Months 📊
The three-month performance indicates a more stabilized outlook, with EXC leading gains. Defensive sectors like utilities could be perceived as attractive amid broader market uncertainties.
| Stock | Performance (%) | Performance |
|---|---|---|
| EXC | 2.12% | |
| D | 1.89% | |
| CEG | 0.78% | |
| DUK | 0.25% | |
| SO | -1.05% | |
| AEP | -1.37% | |
| NEE | -1.97% | |
| PEG | -2.87% | |
| SRE | -5.79% |
Summary ✅
The analysis across various timeframes indicates that while short-term fluctuations are evident, particularly with CEG's standout one-month performance, the overarching stability in the three-month period suggests potential areas of value. Investors should consider the implications of external market conditions and macroeconomic indicators, as defensive sectors may continue to offer relative stability amidst broader market volatility.
Smart Data Insight
Master the Perfect Entry & Exit for this Stock
Don't leave your profits to chance. Historically, this stock follows specific seasonal patterns that institutional traders use to maximize returns.
- ✅ Identify the "Golden Buying Window"
- ✅ Avoid high-risk correction cycles
- ✅ Backtested data from the last 20+ years