
November 17, 2026 a 03:16 pm


Utility Stocks - Performance Analysis
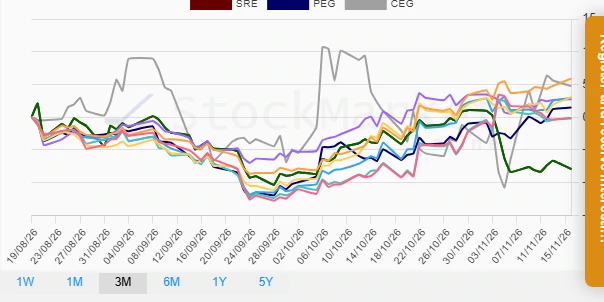
📊 The utilities sector showcases dynamic performance over varying timeframes. Examining the one week, one month, and three month periods offers insights into emerging trends and identifies both outliers and consistent performers. The analyses reveal which stocks are leading or lagging, providing valuable insights for investors and stakeholders within this critical market sector.
Utility Stocks Performance One Week
| Stock | Performance (%) | Performance |
|---|---|---|
| CEG | 3.76 | |
| EXC | 2.03 | |
| PEG | 1.85 | |
| DUK | 1.28 | |
| AEP | 1.17 | |
| SO | 1.07 | |
| SRE | 0.21 | |
| D | -0.83 | |
| NEE | -1.07 |
Utility Stocks Performance One Month
| Stock | Performance (%) | Performance |
|---|---|---|
| DUK | 7.46 | |
| NEE | 7.04 | |
| EXC | 6.82 | |
| D | 6.81 | |
| PEG | 6.36 | |
| SO | 3.92 | |
| CEG | 3.79 | |
| AEP | 1.84 | |
| SRE | -5.81 |
Utility Stocks Performance Three Months
| Stock | Performance (%) | Performance |
|---|---|---|
| DUK | 5.90 | |
| CEG | 4.76 | |
| SO | 3.04 | |
| EXC | 2.96 | |
| AEP | 2.75 | |
| PEG | 1.47 | |
| NEE | -0.13 | |
| D | -0.18 | |
| SRE | -7.91 |
Summary
✅ Over the short term, CEG has demonstrated strong performance over one week, with DUK leading in the one-month timeline and sustaining upward momentum in three months. 📈 Caution should be directed towards SRE, notably underperforming across both one and three months. Overall, diversified strategies focusing on sustained performers like DUK and emerging leaders like CEG may offer balanced returns. Evaluating trends over varied timeframes is imperative to strategize effectively in the utilities sector.
Smart Data Insight
Master the Perfect Entry & Exit for this Stock
Don't leave your profits to chance. Historically, this stock follows specific seasonal patterns that institutional traders use to maximize returns.
- ✅ Identify the "Golden Buying Window"
- ✅ Avoid high-risk correction cycles
- ✅ Backtested data from the last 20+ years