September 16, 2025 a 03:16 pm


Utility Stocks - Performance Analysis
In recent months, the performance of utility stocks has shown varied dynamics across different timeframes. While certain stocks have emerged as top performers in the short and medium terms, others continue to underperform, suggesting a complex landscape shaped by both sector-specific drivers and broader market conditions.
📈 Utility Stocks Performance One Week
| Stock | Performance (%) | Performance |
|---|---|---|
| CEG | 9.62 | |
| SRE | 3.78 | |
| PEG | 3.68 | |
| D | 2.91 | |
| NEE | 2.02 | |
| DUK | 1.65 | |
| SO | 1.16 | |
| EXC | 0.79 | |
| AEP | 0.68 |
📈 Utility Stocks Performance One Month
| Stock | Performance (%) | Performance |
|---|---|---|
| CEG | 2.89 | |
| SRE | 2.78 | |
| DUK | -0.02 | |
| D | -0.80 | |
| SO | -1.89 | |
| EXC | -2.55 | |
| AEP | -2.56 | |
| PEG | -2.70 | |
| NEE | -5.24 |
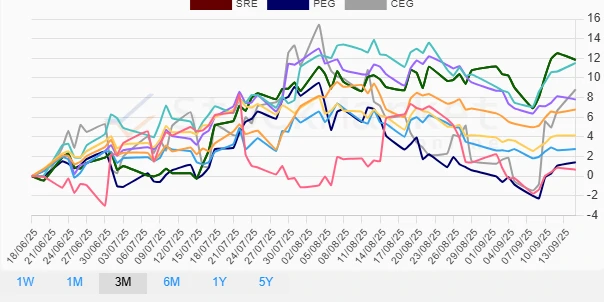
📈 Utility Stocks Performance Three Months
| Stock | Performance (%) | Performance |
|---|---|---|
| SRE | 11.84 | |
| D | 11.53 | |
| CEG | 8.82 | |
| AEP | 7.81 | |
| DUK | 6.79 | |
| SO | 4.14 | |
| EXC | 2.76 | |
| PEG | 1.41 | |
| NEE | 0.66 |
💡 Summary
Analysis of utility stocks over varying time durations demonstrates the dynamic nature of stock performance within the sector. For the one-week duration, CEG outperformed significantly, whereas NEE lagged notably over the one-month period. Observing a substantial three-month performance, SRE and D emerged as leaders, underpinning strategic strength in prolonged market conditions. Investors should consider a diversified approach given these performances, balancing potential risks and rewards by prioritizing stocks that demonstrate resilience and consistent growth trends.
Smart Data Insight
Master the Perfect Entry & Exit for this Stock
Don't leave your profits to chance. Historically, this stock follows specific seasonal patterns that institutional traders use to maximize returns.
- ✅ Identify the "Golden Buying Window"
- ✅ Avoid high-risk correction cycles
- ✅ Backtested data from the last 20+ years