
September 15, 2026 a 03:16 pm


Utility Stocks - Performance Analysis
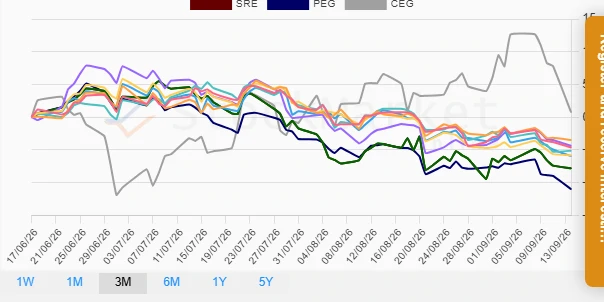
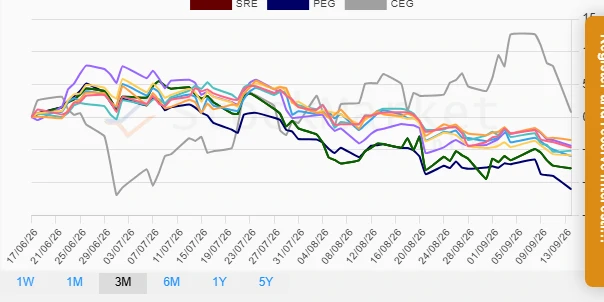
The utility sector, known for its stability and consistent dividends, has faced significant volatility recently. Over the past three months, all stocks in review except CEG have reported negative trends. This analysis seeks to unravel the performance across different periods, shedding light on sector-wide trends and identifying the leaders and laggards.
Utility Stocks Performance One Week
🔍 The one-week performance indicates a bearish trend across the sector with CEG plummeting the most. The week reflects a negative sentiment possibly driven by broader economic concerns or sector-specific challenges.
| Stock | Performance (%) | Performance |
|---|---|---|
| CEG | -11.94 | |
| PEG | -4.53 | |
| SRE | -2.94 | |
| EXC | -2.83 | |
| D | -2.67 | |
| NEE | -2.65 | |
| AEP | -2.56 | |
| SO | -2.26 | |
| DUK | -1.84 |
Utility Stocks Performance One Month
📉 Over the one-month horizon, the sector continued its negative trend, with SO and D showing considerable declines. Diversification appears limited in mitigating these sector-wide challenges.
| Stock | Performance (%) | Performance |
|---|---|---|
| EXC | -7.00 | |
| PEG | -6.87 | |
| SO | -6.37 | |
| D | -6.39 | |
| CEG | -5.86 | |
| NEE | -5.36 | |
| SRE | -3.70 | |
| DUK | -3.94 | |
| AEP | -2.61 |
Utility Stocks Performance Three Months
📊 Over the three-month horizon, the data showcases mixed results with CEG experiencing the only positive trend, highlighting its resilience. However, PEG and SRE faced significant declines.
| Stock | Performance (%) | Performance |
|---|---|---|
| PEG | -11.00 | |
| SRE | -7.81 | |
| EXC | -5.95 | |
| SO | -5.84 | |
| D | -5.11 | |
| NEE | -4.63 | |
| AEP | -4.38 | |
| DUK | -3.48 | |
| CEG | 0.73 |
Summary
✅ In summary, the utility sector has generally trended downwards over the analyzed periods, with only slight positive movement for CEG in the three-month timeframe. Investors should remain cautious, potentially exploring opportunities to diversify or focusing on stocks that exhibit resilience in the face of broader industry challenges.
Smart Data Insight
Master the Perfect Entry & Exit for this Stock
Don't leave your profits to chance. Historically, this stock follows specific seasonal patterns that institutional traders use to maximize returns.
- ✅ Identify the "Golden Buying Window"
- ✅ Avoid high-risk correction cycles
- ✅ Backtested data from the last 20+ years